PDF outcome please download here:
Brief.
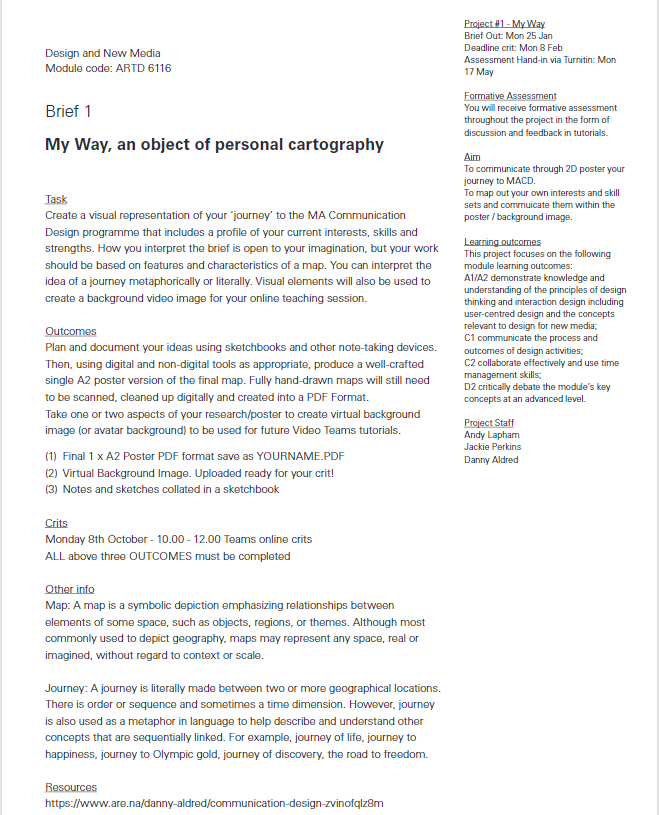
This is our brief for week one, in summary we need to create a map that describes how we made our journey to MA Communication Design. The map could be physical or digital; Metaphorically or literally.
Initial Idea.
Memories and Senses.
The first relatable thing that came to my mind was the term ‘Memory‘. We were told to create a map that presents our journey, and I believe that ‘memory’ is one of the core components because in order to record something, we need to remember them first.
- According to EVERYDAY EINSTEIN SABRINA STIERWALT, the part of our brain that controls senses is also in charge of the emotional memories, therefore by smelling, hearing, touching or seeing things can trigger certain memories.
- I believe that some people were grown up with memorable moments that have huge connections to the hearing, an example from me is whenever I hear SAMSUNG morning alarm, I get the flashback of me waking up in the early morning and getting ready for schools, it was a purely nightmare.
- Throughout our journey, the senses are always there whether you notice them or not. This is a very interesting topic and also a great opportunity for me to dive into it.
Sound & Memories Mindmap.
The very first thing I did was to brainstorm the sounds that are most likely to trigger my memories.

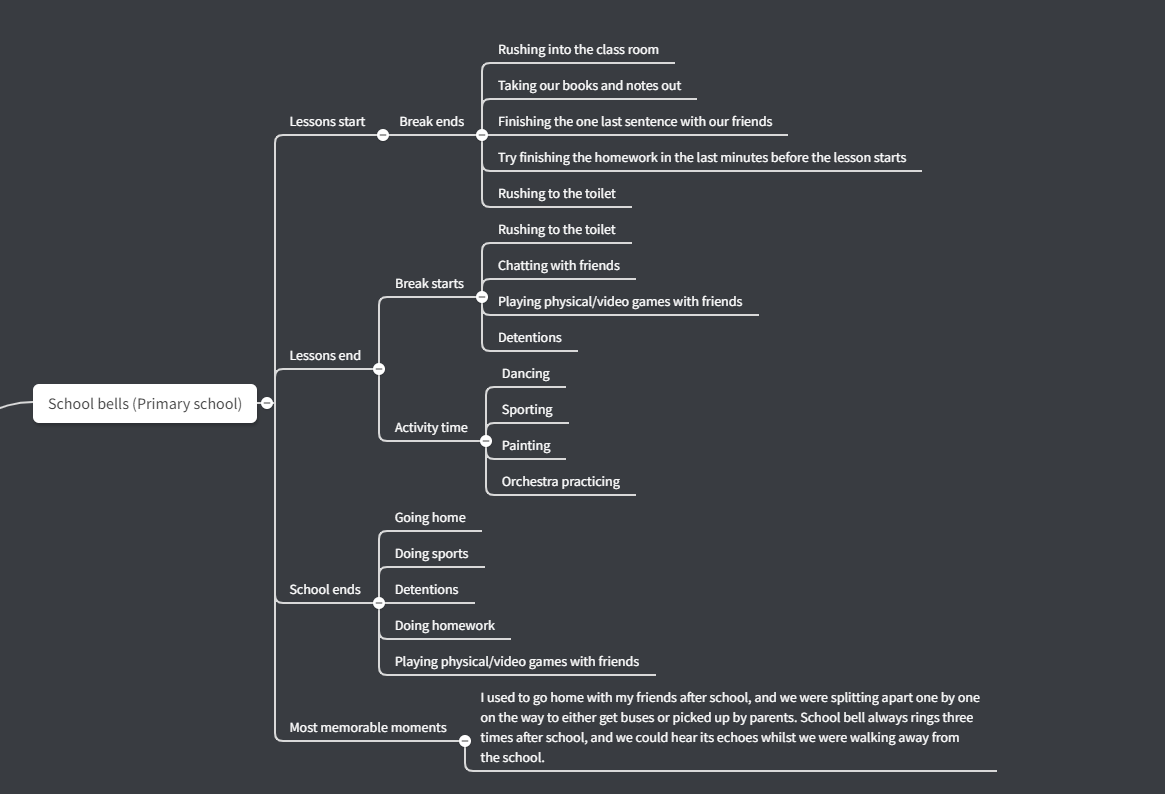
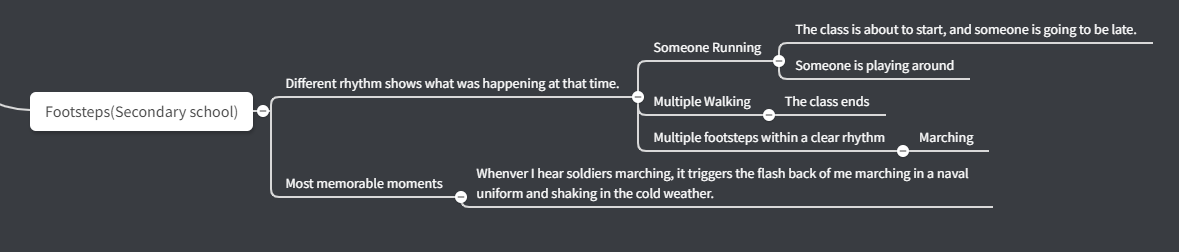
Out of all the sounds, I picked three of them which can best represent my experiences in different stages throughout my student career, they are ‘School bell’, ‘Footsteps’ and ‘Game music I made’.
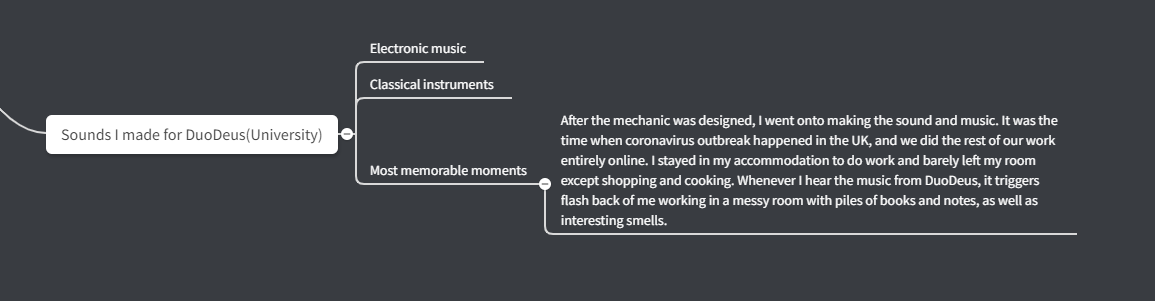
I also made a detailed mind map that shows the memories I was triggered by each individual sound:
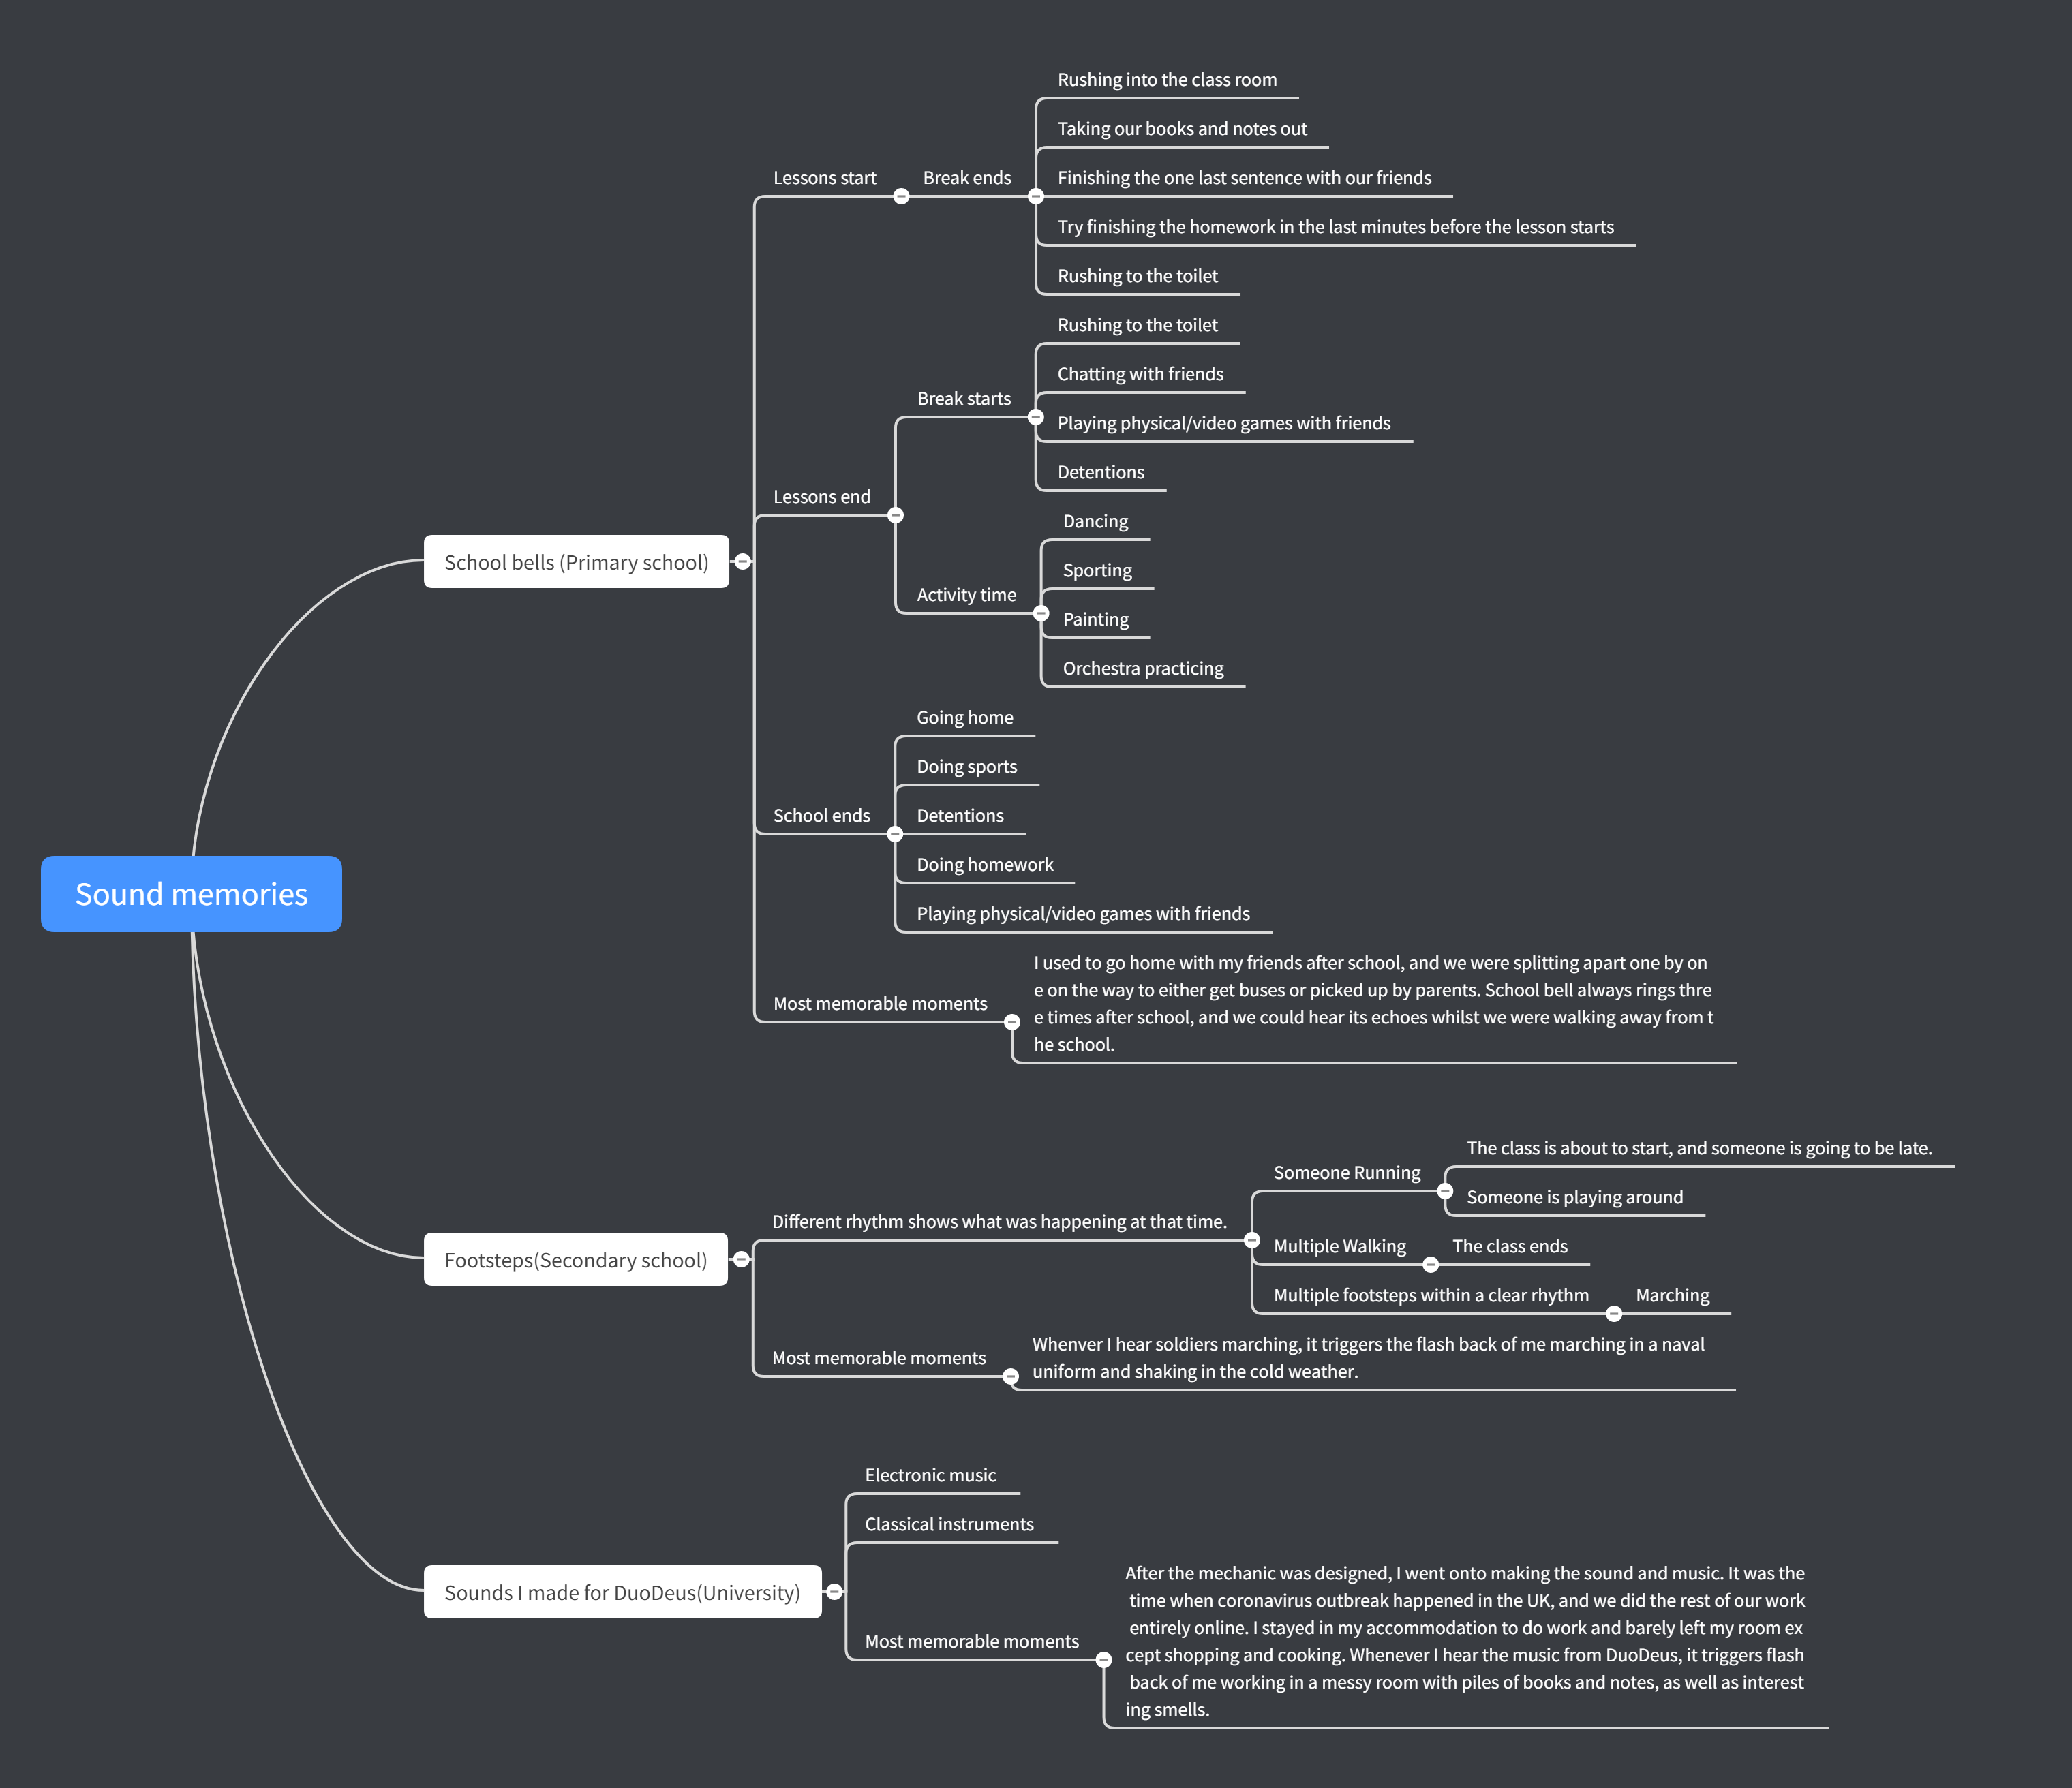
Here are the sections in ‘Sound & Memories’ mind map:
Throughout making these mind maps and brainstorms, I have came up with a concept for my initial idea: To find sounds that trigger some of the most memorable moments in my life, then visualize and compile them into a map which records my journey to MA Communication Design.
Plan.
In order to expand my initial idea, I have made a quick plan which includes some questions and directions that are currently bouncing in my head.
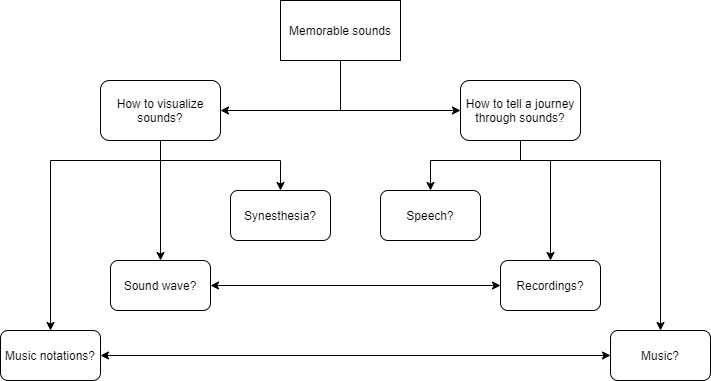
In this plan, I have separated my initial idea into two directions:
1. How to visualize sounds?
2. How to tell a journey through sounds?
By simply summing up, we can see that Music is basically relating to the Music notation, and Recordings is relatable with the Sound wave.
Therefore, I will be expanding my research into 4 directions: Musical notations, Sound wave, Synesthesia and Speech.
Musical notations.
According to Ian D. Bent, Musical notation is visual record of heard or imagined musical sound, or a set of visual instructions for performance of music. It usually takes written or printed form and is a conscious, comparatively laborious process. Its use is occasioned by one of two motives: as an aid to memory or as communication.
In other words, musical notation visualizes sounds.
Here is a tutorial that teaches people how to read music, based on the most commonly used musical notation method : Staff
Through this video, we understand that there are 5 lines in a staff sheet, and each one of them represents a musical pitch, such as E, G, B, D, F; Spaces next to the lines are also representing musical pitches, such as: D, F, A, C, E, G.
In summary, staff provides an easy way to record music, as well as making music readable. This might be a good way to not only visualize the sounds, but also to tell a journey according to my initial idea.
Here are some examples of the Staff sheets:

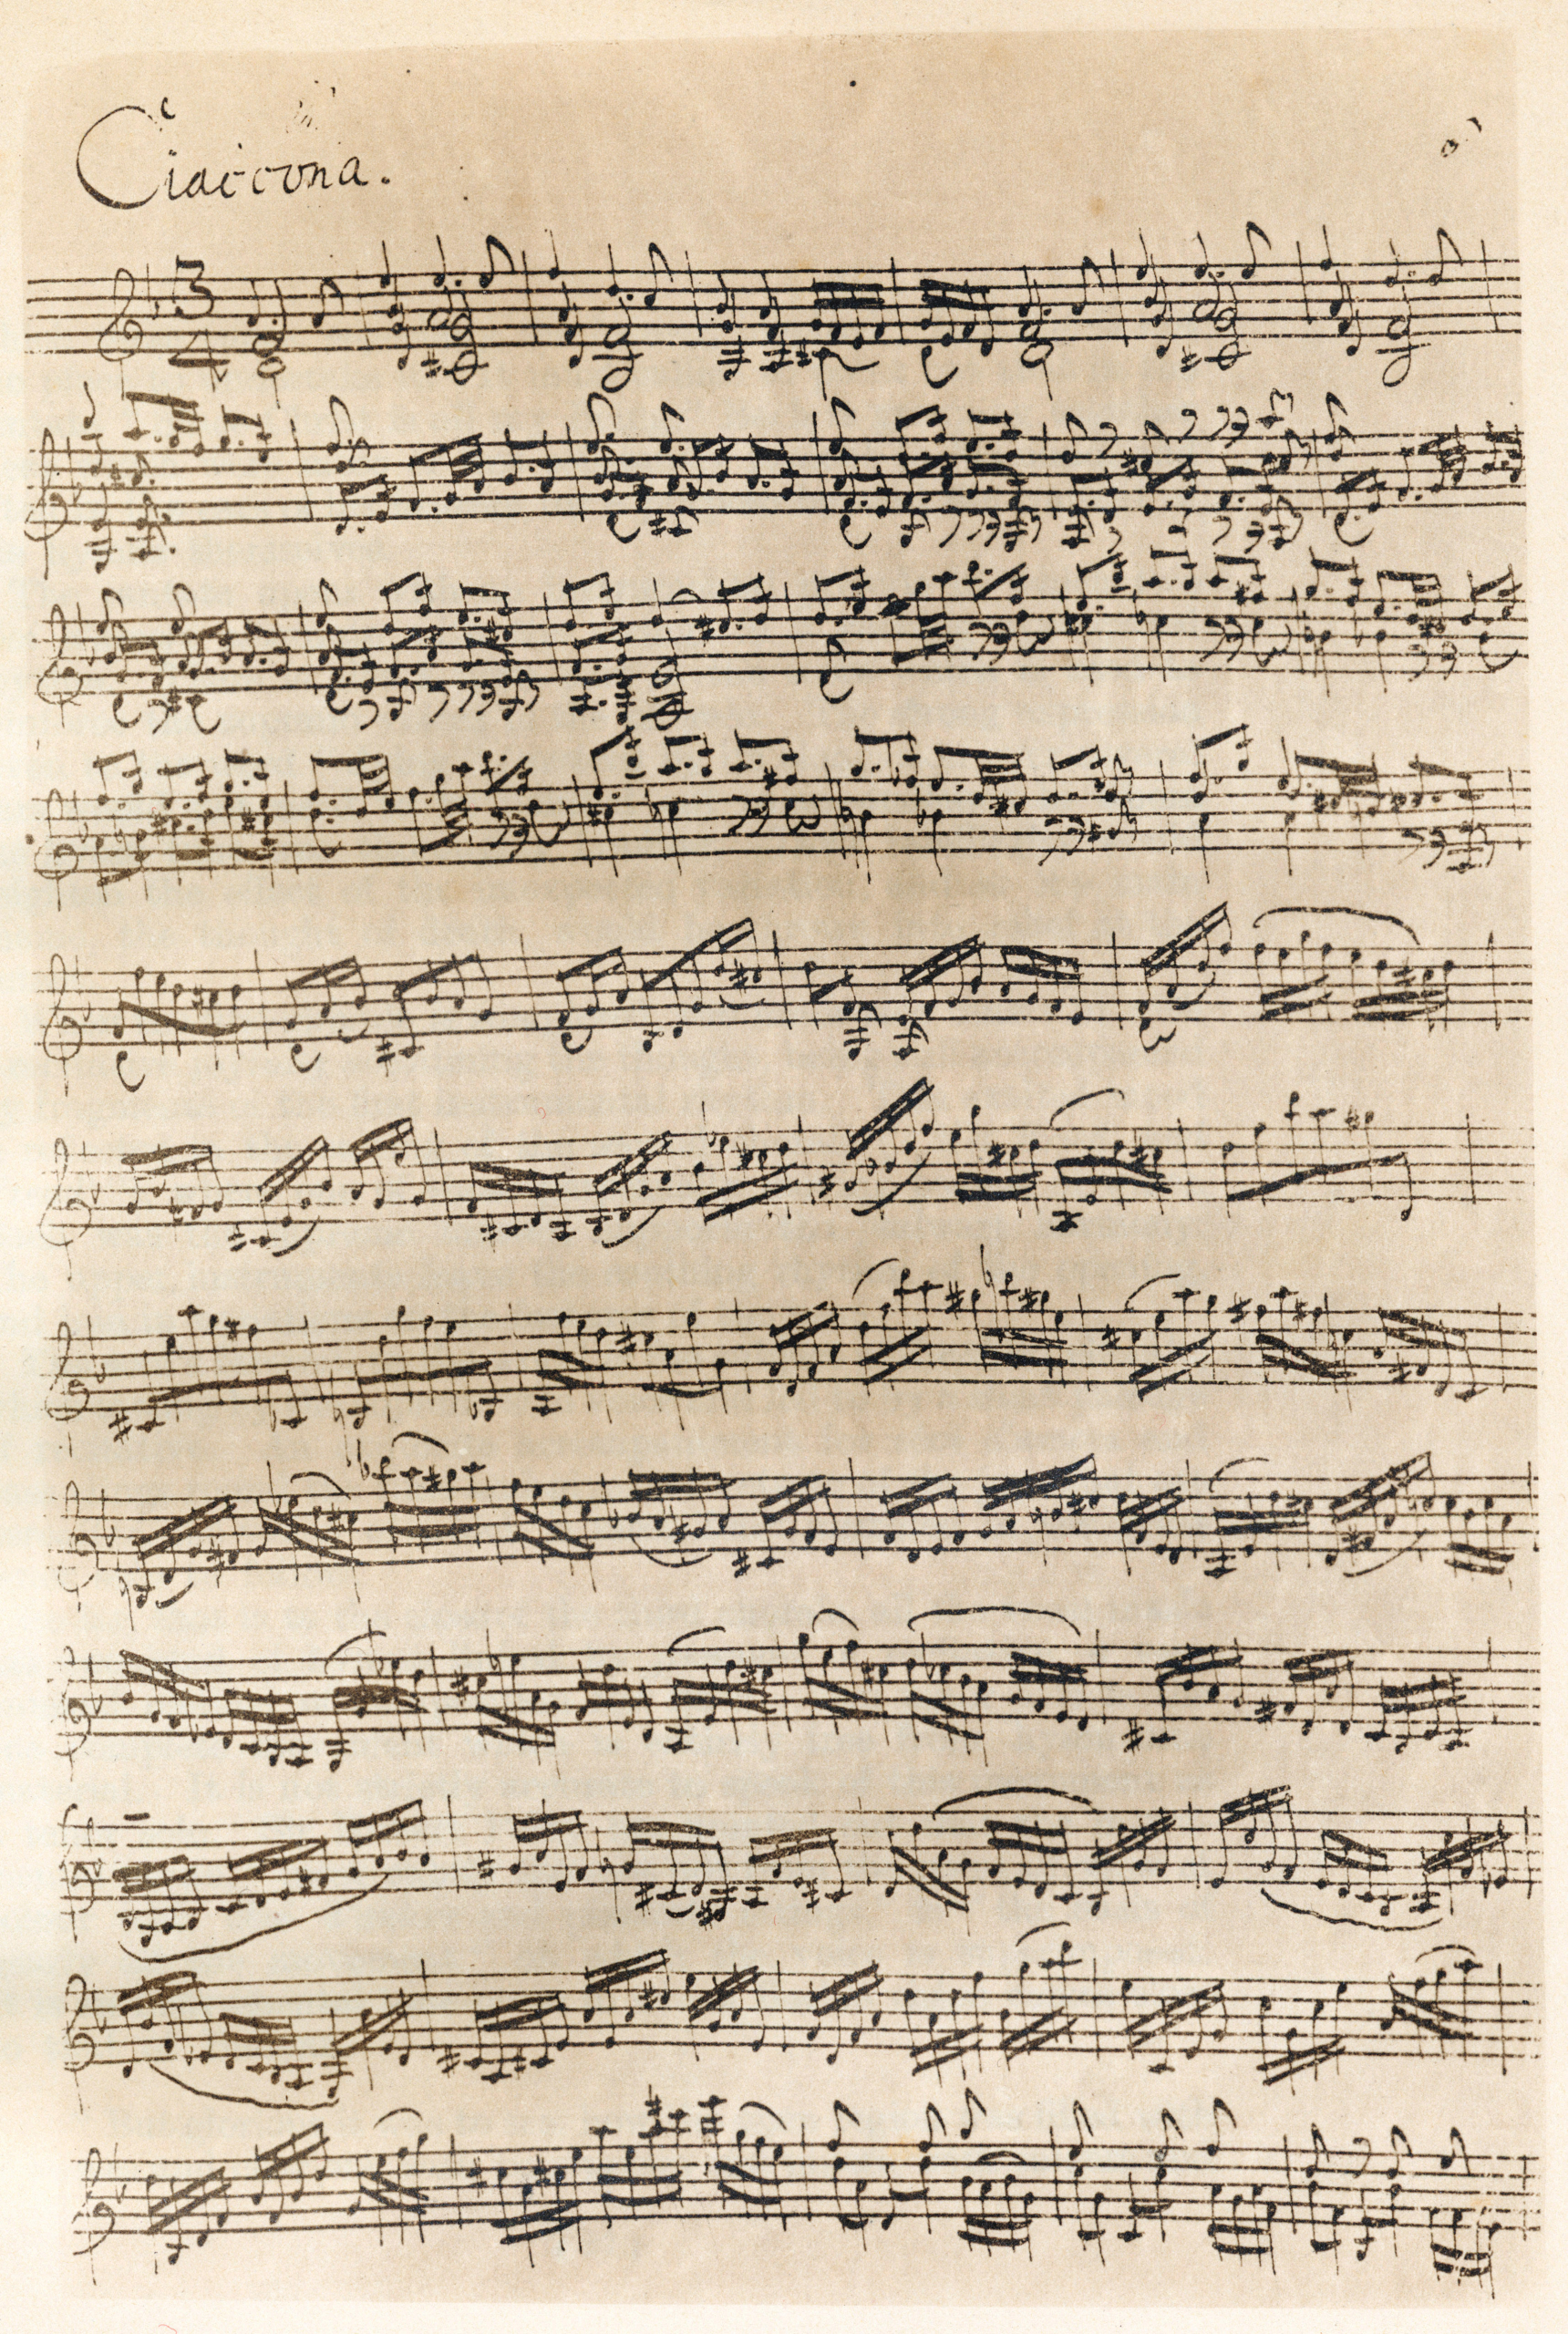

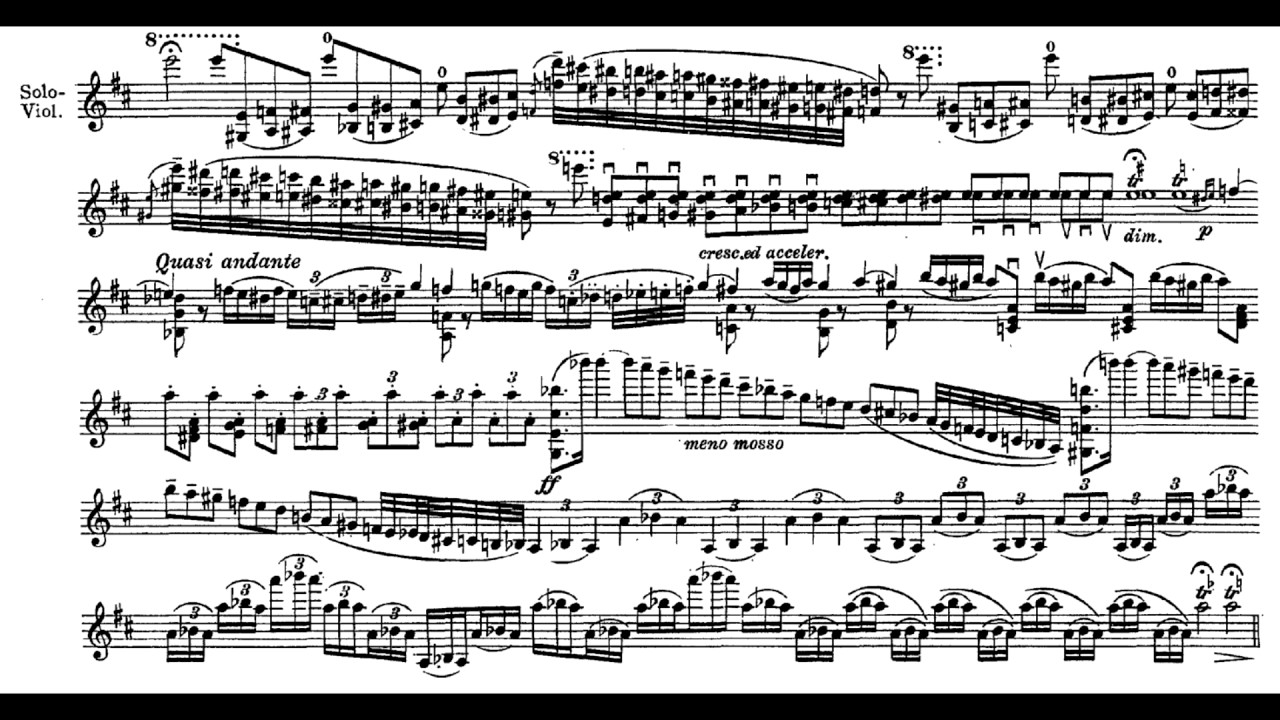
I am interested in the shapes and the structures that are built by notes in these staff sheets. For example, we can see there are parts where the notes are going either upwards or downwards in order to form a slope; there are also parts where the notes have dramatic drops, meaning one note is higher up and suddenly the next note drops to the lower section. Furthermore, I can almost feel the momentum of the sound by only looking at the sheet music, because it seems like the notes are directing us to situations where we know they are going to be gentle, aggressive or dramatic etc.. (Through the thickness or complexity from the upcoming notes)
The entire experience of exploring and understanding staff sheets is inspiring, and I think the momentum as well as the structures in them could be some good materials to use building my map.
Speaking of the structures, here are some experimental music sheets and art work I found:

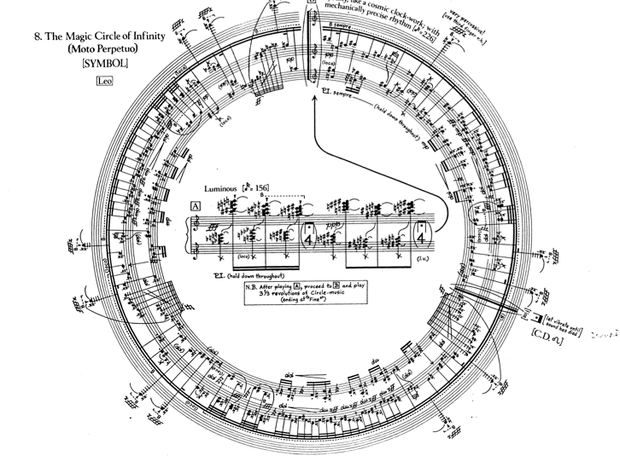
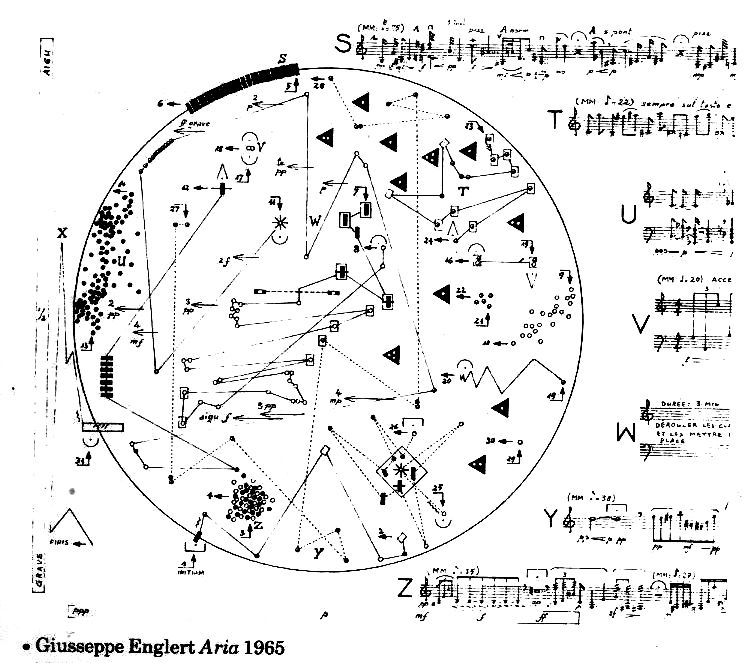


Composers in 20th century are tend to explore something new in the music field. They realized music shouldn’t just be written on a staff sheet like formulas, they are alive and have unlimited potentials to explore, and that is why the experimental music appears. Images above shows series of experimental music sheets, and I personally think they are not just new ways to express musical ideas, but also maps to guide the musicians.
For instance, see description for ‘Music with Timing Devices’ by Reed Maxon:
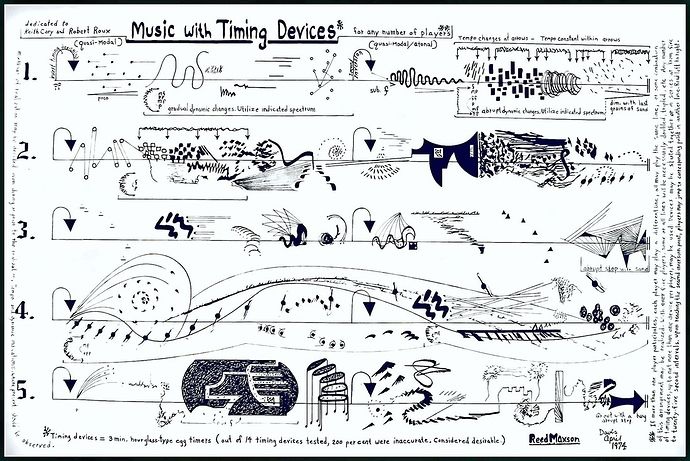
The “timing devices” used in the the piece below were three minute “hourglass” type egg timers. They were inverted at the beginning (first inversion) and once again (second inversion) after the first three minutes, the music ending after the second three minutes. If two or more players participated, each with a timer, they could either invert in unison at the beginning or stagger their entrances. Players had the option of jumping to a different line upon second inversion, a modulation not likely noticeable even if anyone had been paying attention. Several egg timers were tested and found to be 200% inaccurate, being in disagreement with each other as well as with themselves upon inversion. This discrepancy was considered desirable.
The best thing about experimental music sheets is that they are not only musical notations, but also artistic visualizations. By reading them, I was inspired and eager to know how did the composers come up with these ideas of visualization.
In order to continue my research, I decided to dive deeper and find out how music is visualized in different ways. Instead of looking at how the visualization will be developed in the future, I stepped back and looked for the musical notations in the past.
The first example here is the Byzantine music notations:


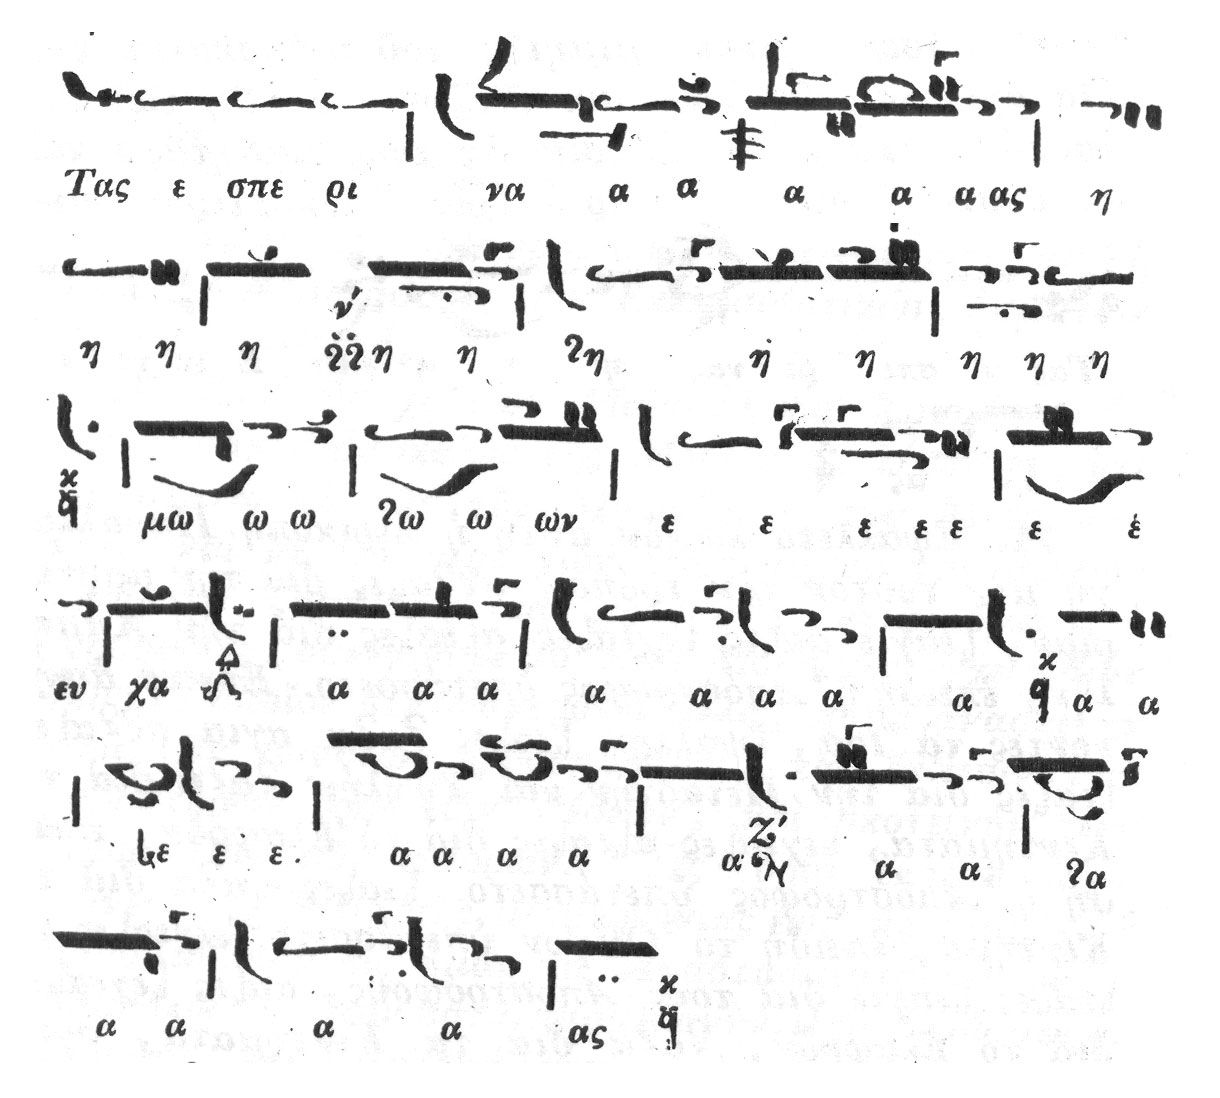
The clear differences between Byzantine notation and staff notations are the former don’t have lines or notes to indicate the pitches. Instead, they uses syllables to indicate pitches, and wavy lines to show the rhythm as well as the structures of the music.
Here is a useful tutorial that teaches people how to read byzantine music:
The contrasts between staff notations and byzantine music notations are interesting, because they are basically doing the same thing, which is making music readable, but in so many different ways. Personally, I prefer the aesthetic of byzantine music notation, because it looks similar to a hand written script which expresses the idea of telling a story through music.
Another example is called the Chinese Guqin notation, see images below:
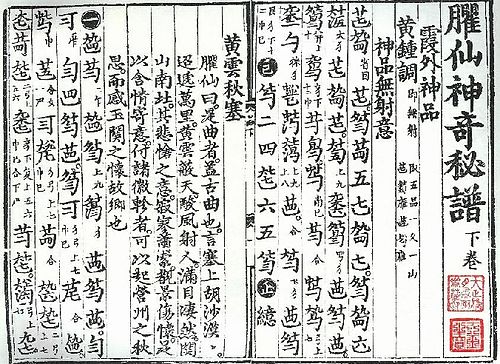
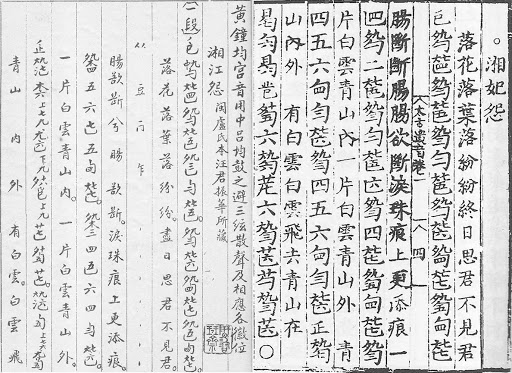

Aesthetically, Guqin notations look like Chinese symbols but not for the daily use. These notations are only used when playing a Chinese instrument called Guqin.
Here are two images that demonstrate how Guqin notation work:
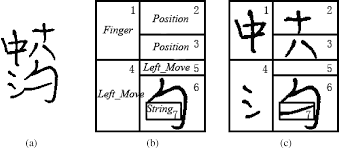
(a) This is a Guqin notation, it is constructed with both Chinese symbol and parts of them.
(b) As what was shown in the image, the notation has been differentiated into 6 parts, and indications for techniques will be held inside each part. In section 1, it tells the musician which finger to use from the left hand; In section 2 & 3, it tells where the left hand should be positioning; In section 4, it tells which technique to use for the left hand finger; In section 6, it tells which technique to use for the right hand finger; And finally, in section 7, it is the string which all above sections are playing on.
(c) This is a demonstration which explains both (a) and (b).
This video describes how Guqin notation work:
By looking into Guqin notation, I noticed that there is a clear difference between this type of notation and the couple we looked at before. Guqin notation focuses more on how to make sounds instead of telling people which sound to make. That is to say, Guqin notation records the techniques but not the musical itself. Maybe this is the reason why this notation can only be used on Guqin and not anything else.
However, it is amusing to see the techniques been compiled into a symbol-like notation, and when you think about it, each symbol is almost like passing an information on you, which is quite inspiring.
Throughout doing researches on the music notations, I was inspired by how people use visual languages to represent both the sounds as well as the techniques to make sounds. It would be beneficial to use one of these notation methods to create my map.
Initial reflection ① : Violin notation.
To reflect, I created the ‘Violin notation’ based on the theory of Guqin notation, here is the outcome:
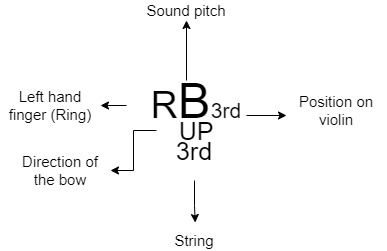
The image above is an instruction for the ‘Violin notation’:
“R” means the finger that the musician should be using for this pitch;
“B” means the pitch that the musician should be playing;
“3rd” on the top means the musician should play this pitch in the 3rd position on violin;
“Up” means the bow should go upwards when playing;
“3rd” at the bottom means the pitch is playing on the 3rd string.
In the staff sheet, this notation should look like this:

After I have done a little bit of testing on the ‘Violin notation’ I created, I then moved onto making a melody:
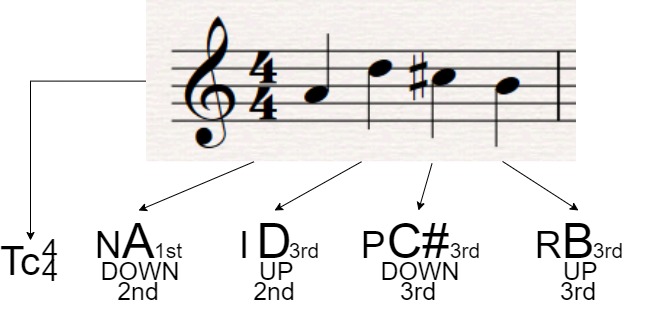
Notations are pretty much functioning the same as the one I have experimented above, but there is a new thing here, which is the ‘Tc44’.
‘Tc’ means Treble clef, the pitch range of this set of melody;
’44’ means the time signature, which means there are 4 crochets in a bar.
After experimenting with ‘Violin notation’ based on Guqin notation, I realized that there is no indications of pitch range, time signature and rhythm in this type of notations. This means that the musicians are only given the sound, but not the rhythm or speed. In other words,’You are given the sounds, play it by your feeling and make it your own music‘. I really like this concept and willing to expand it later in this project.
In conclusion, I came up with a concept of ‘Single block of notation can tell a story, through sounds’. I will be starting to think about this concept whilst moving onto the next research.
Sound Wave.
According to NASA: Waves are created when energy is transferred through a medium like water or air. There are two types of waves, transverse and longitudinal (sometimes called pressure or compression waves). When people think of waves, they often think of transverse waves.
Here is an example from Science Learning Hub, showing how microphone picks up the sound and visualize it into sound waves:
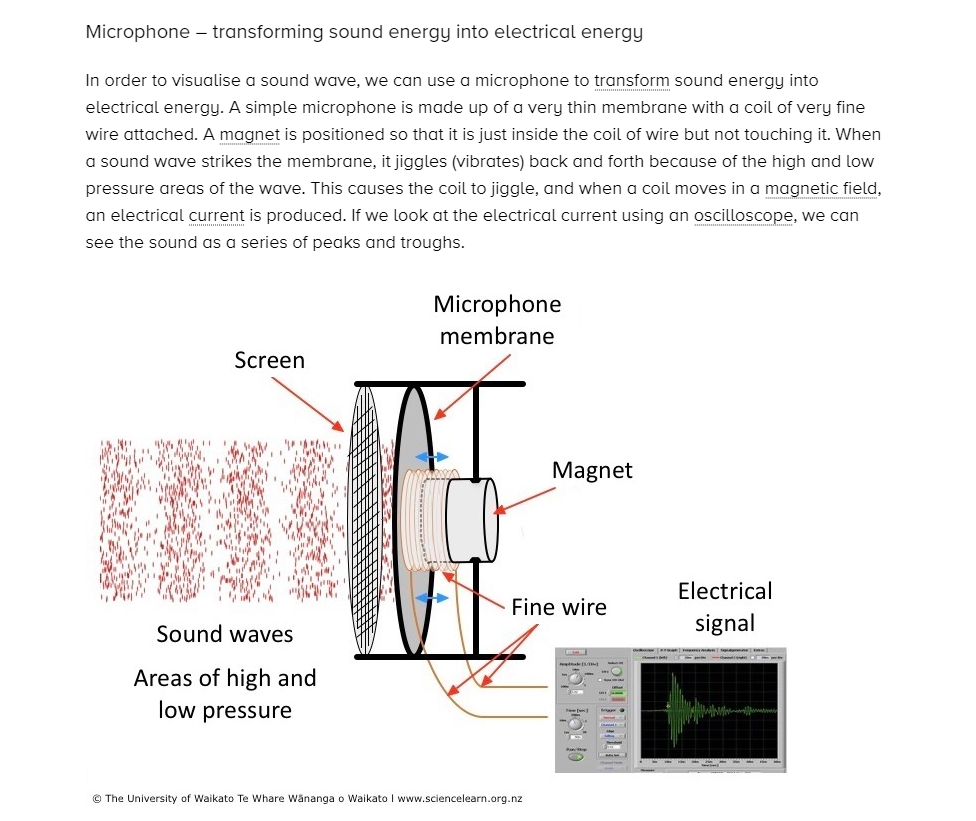
It is an interesting topic to discuss about the physics behind sound waves, however, my objective is to discover cool visualization of the sounds.
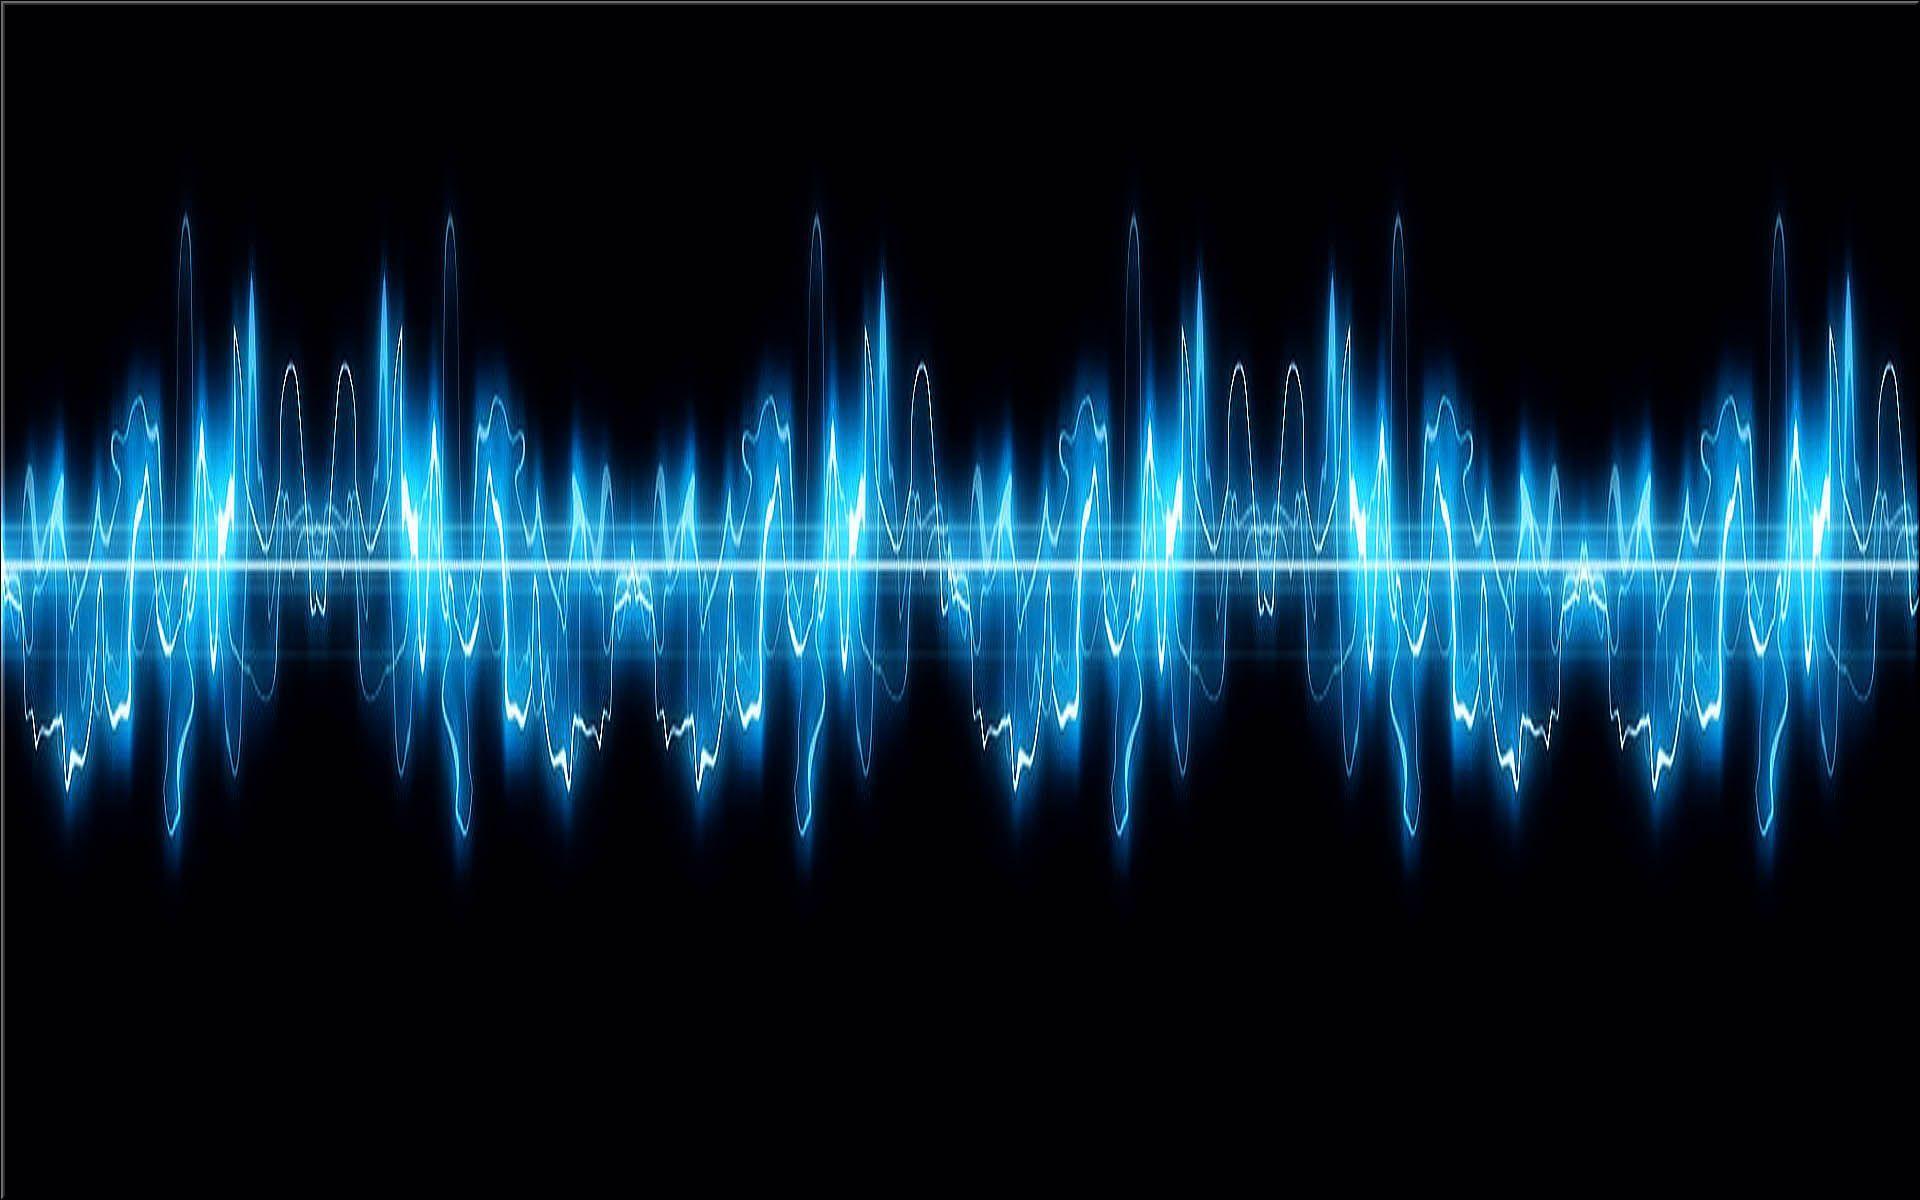

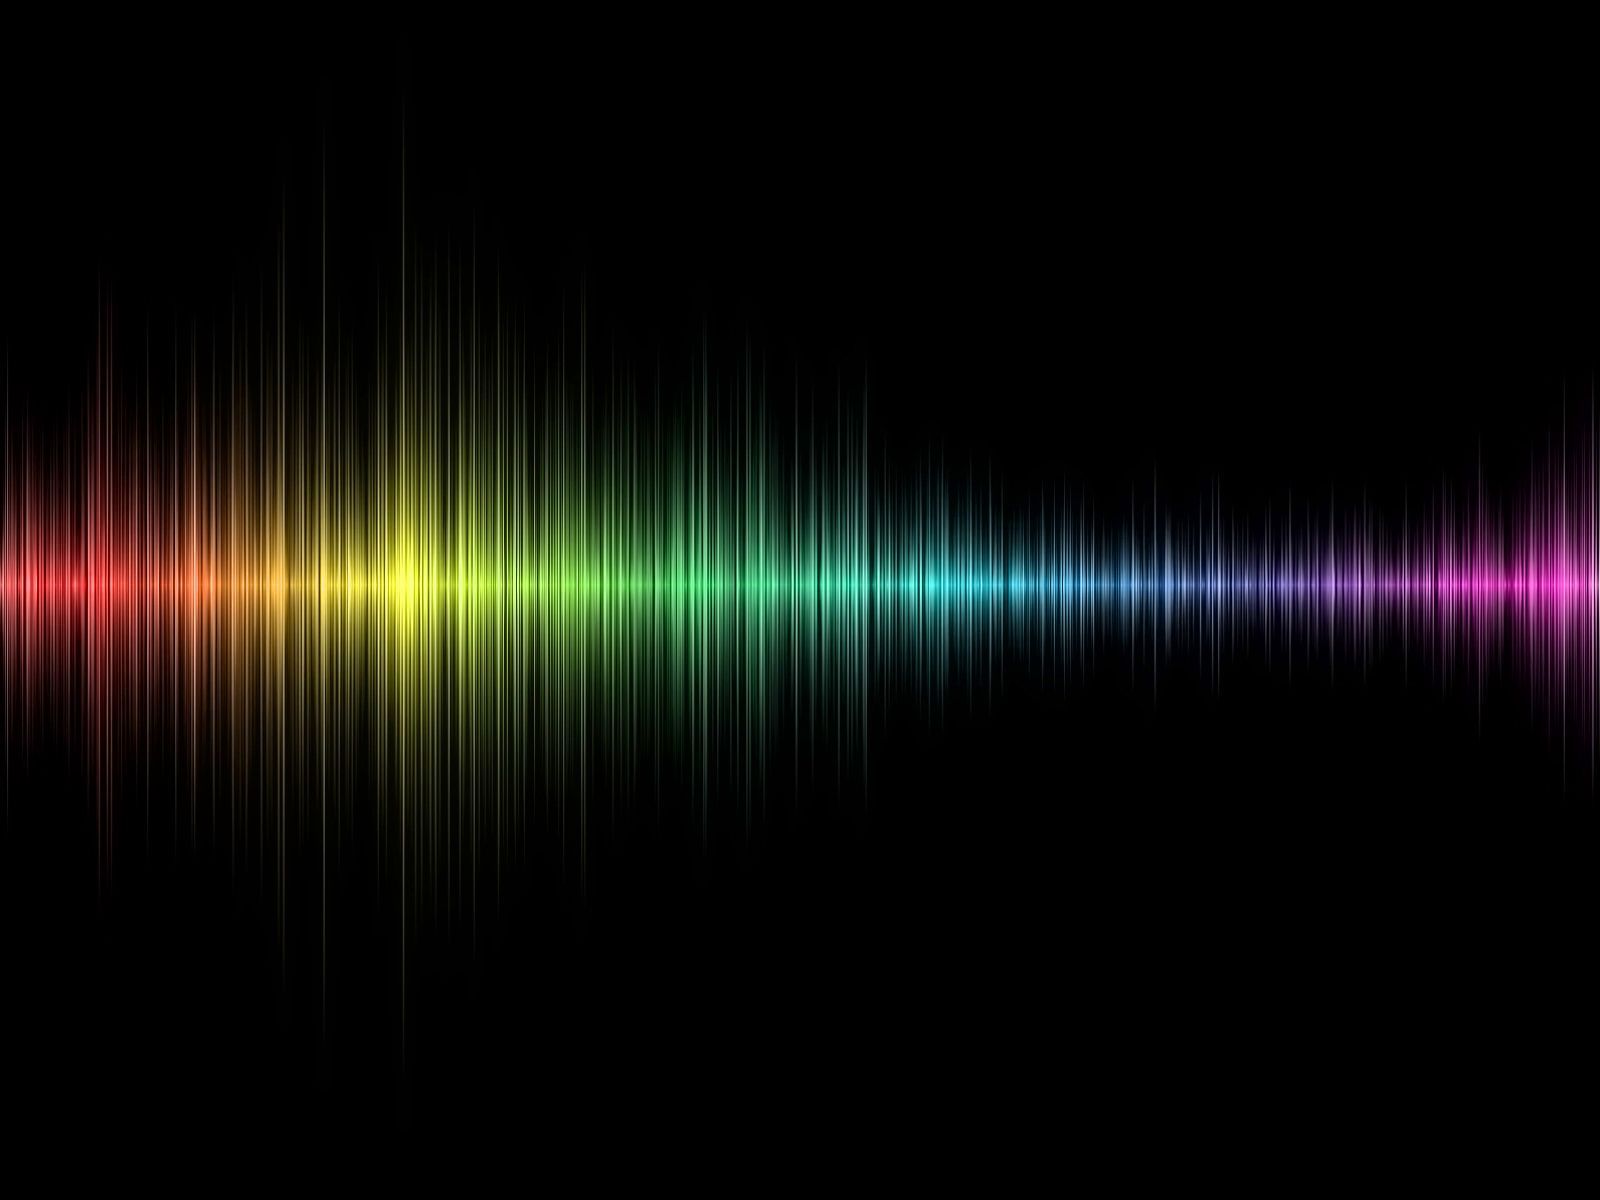


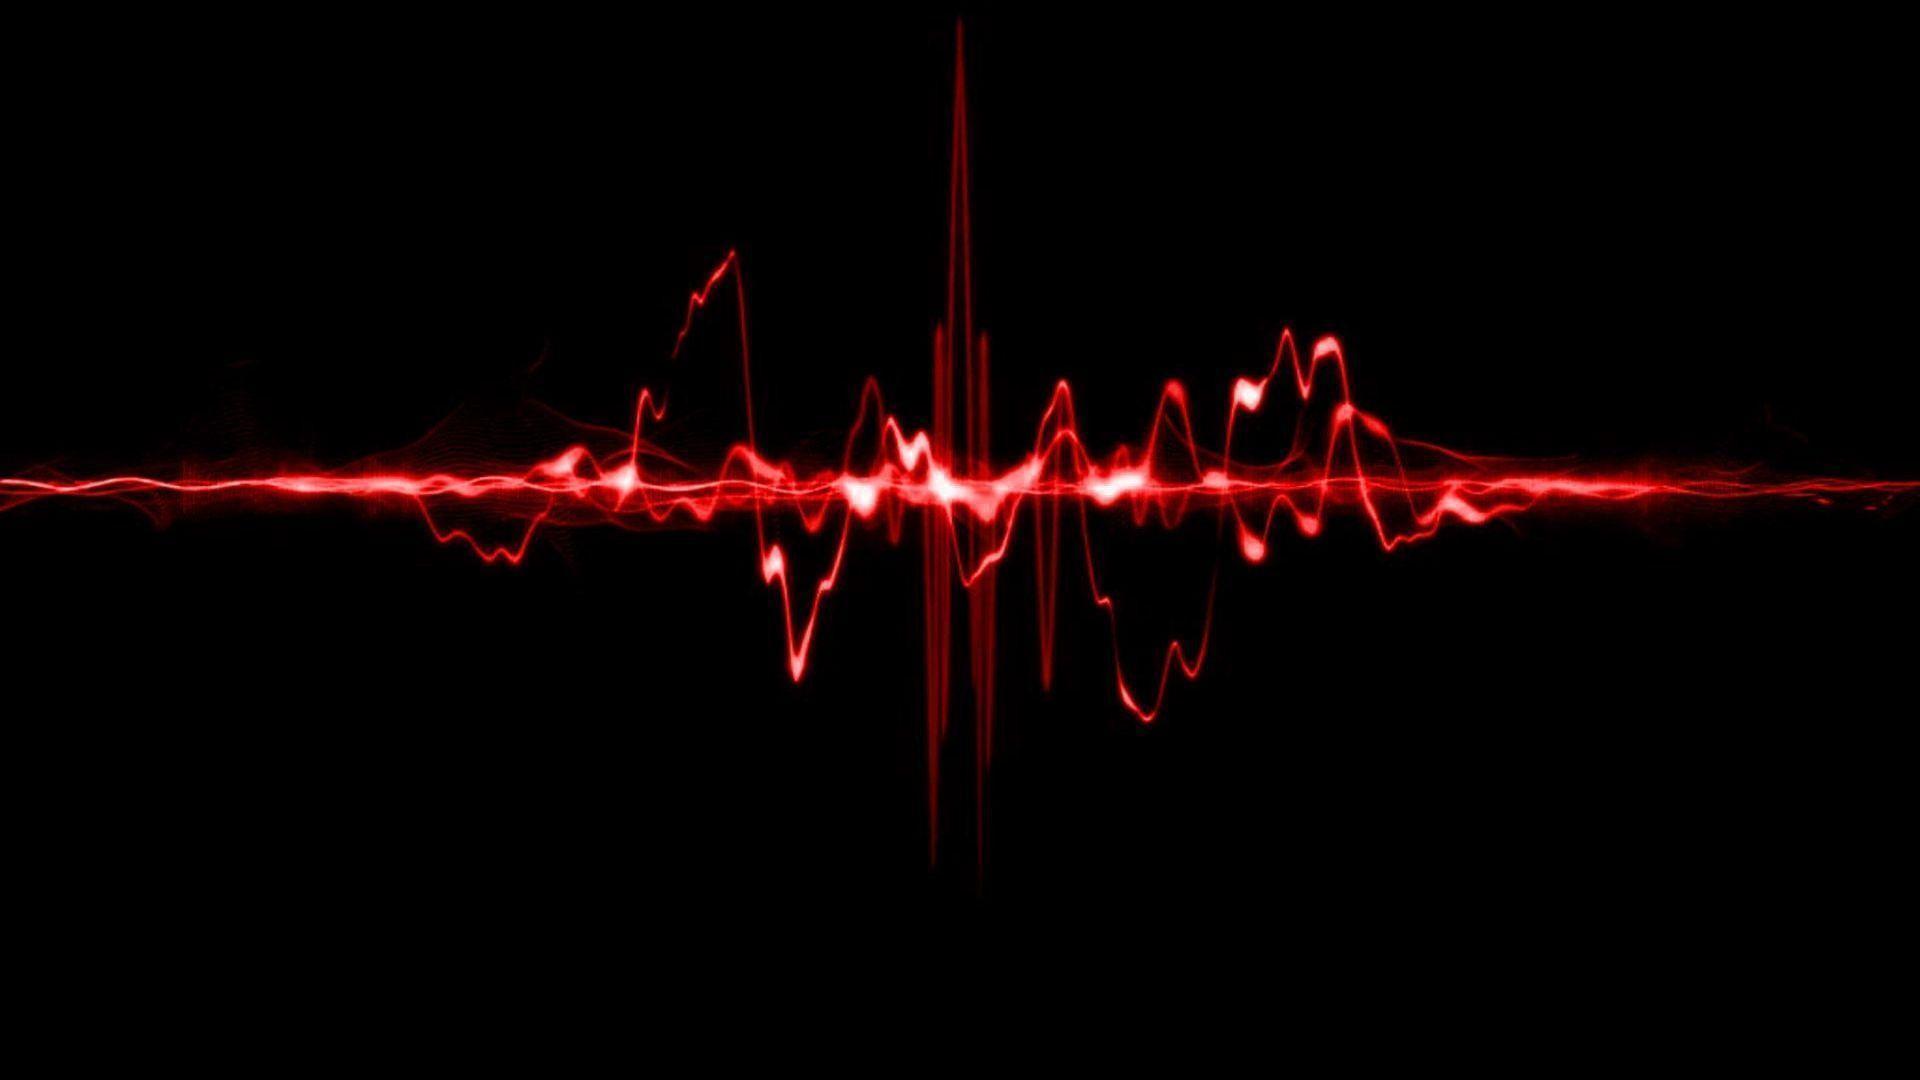
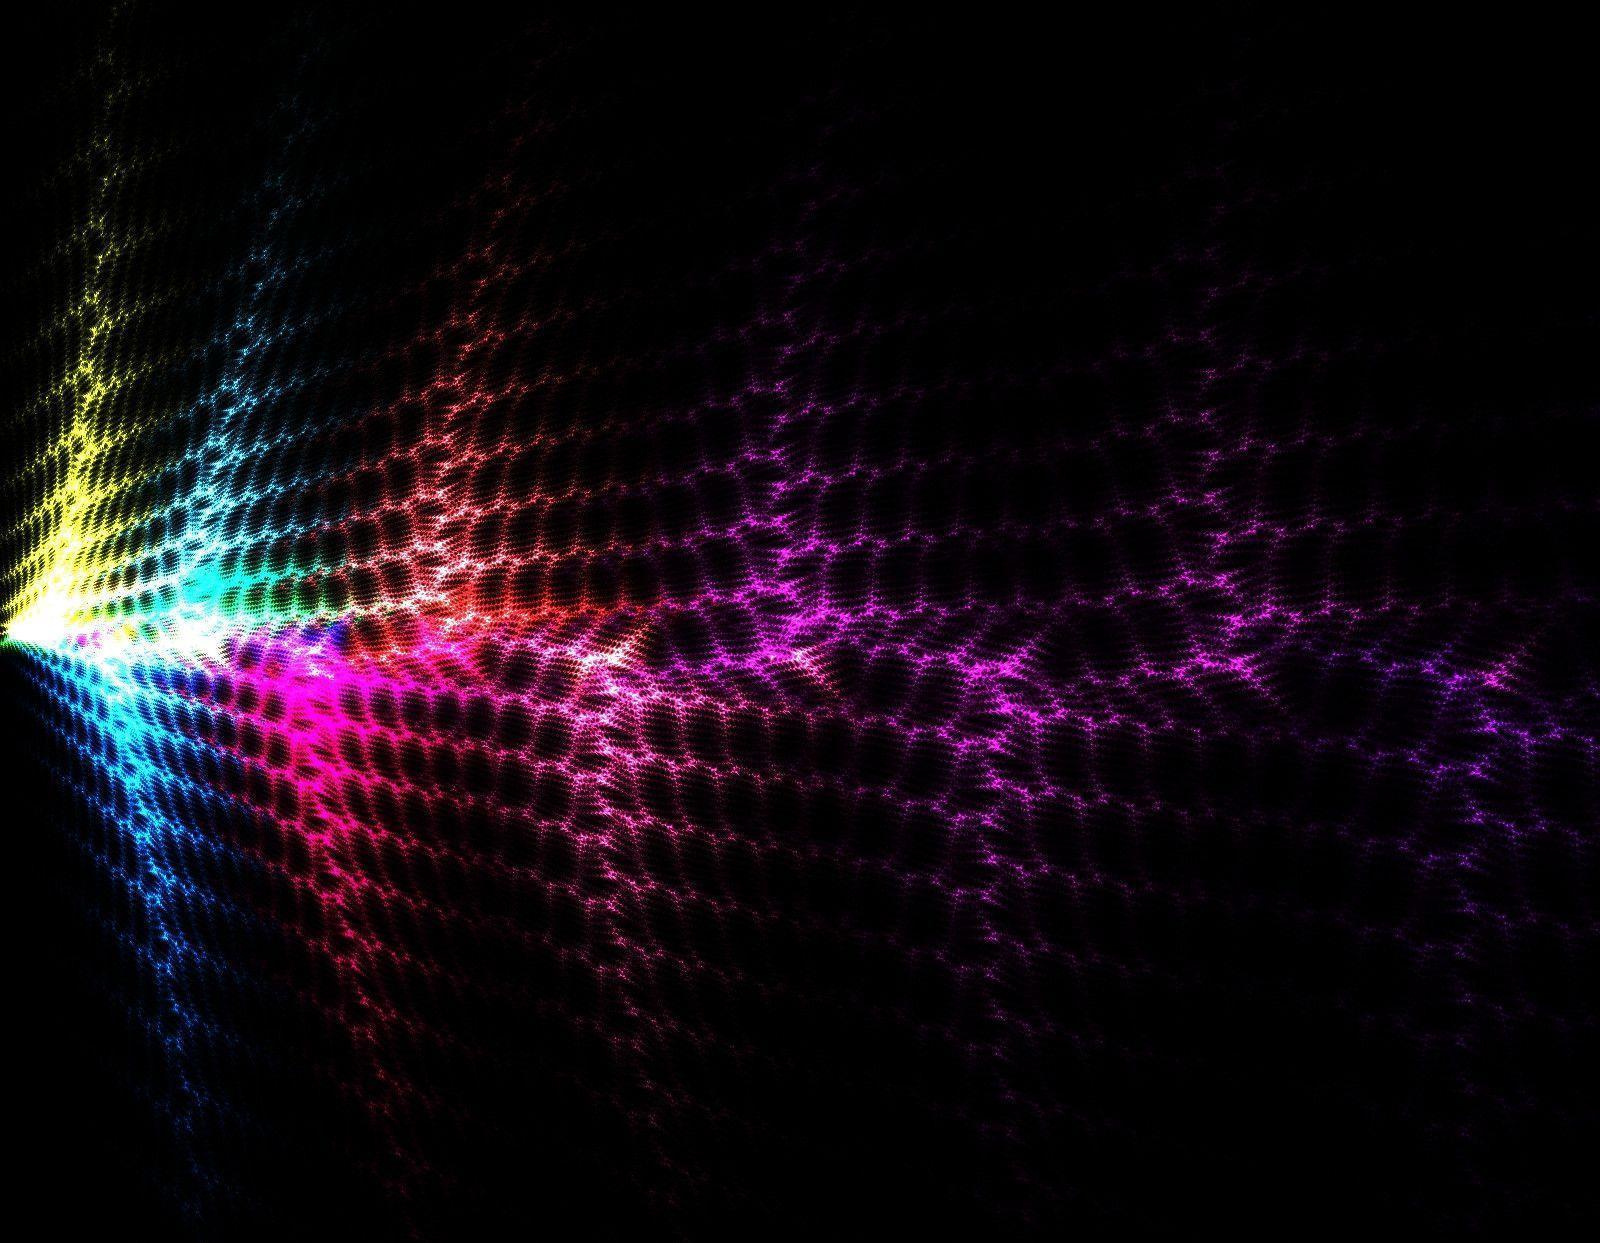
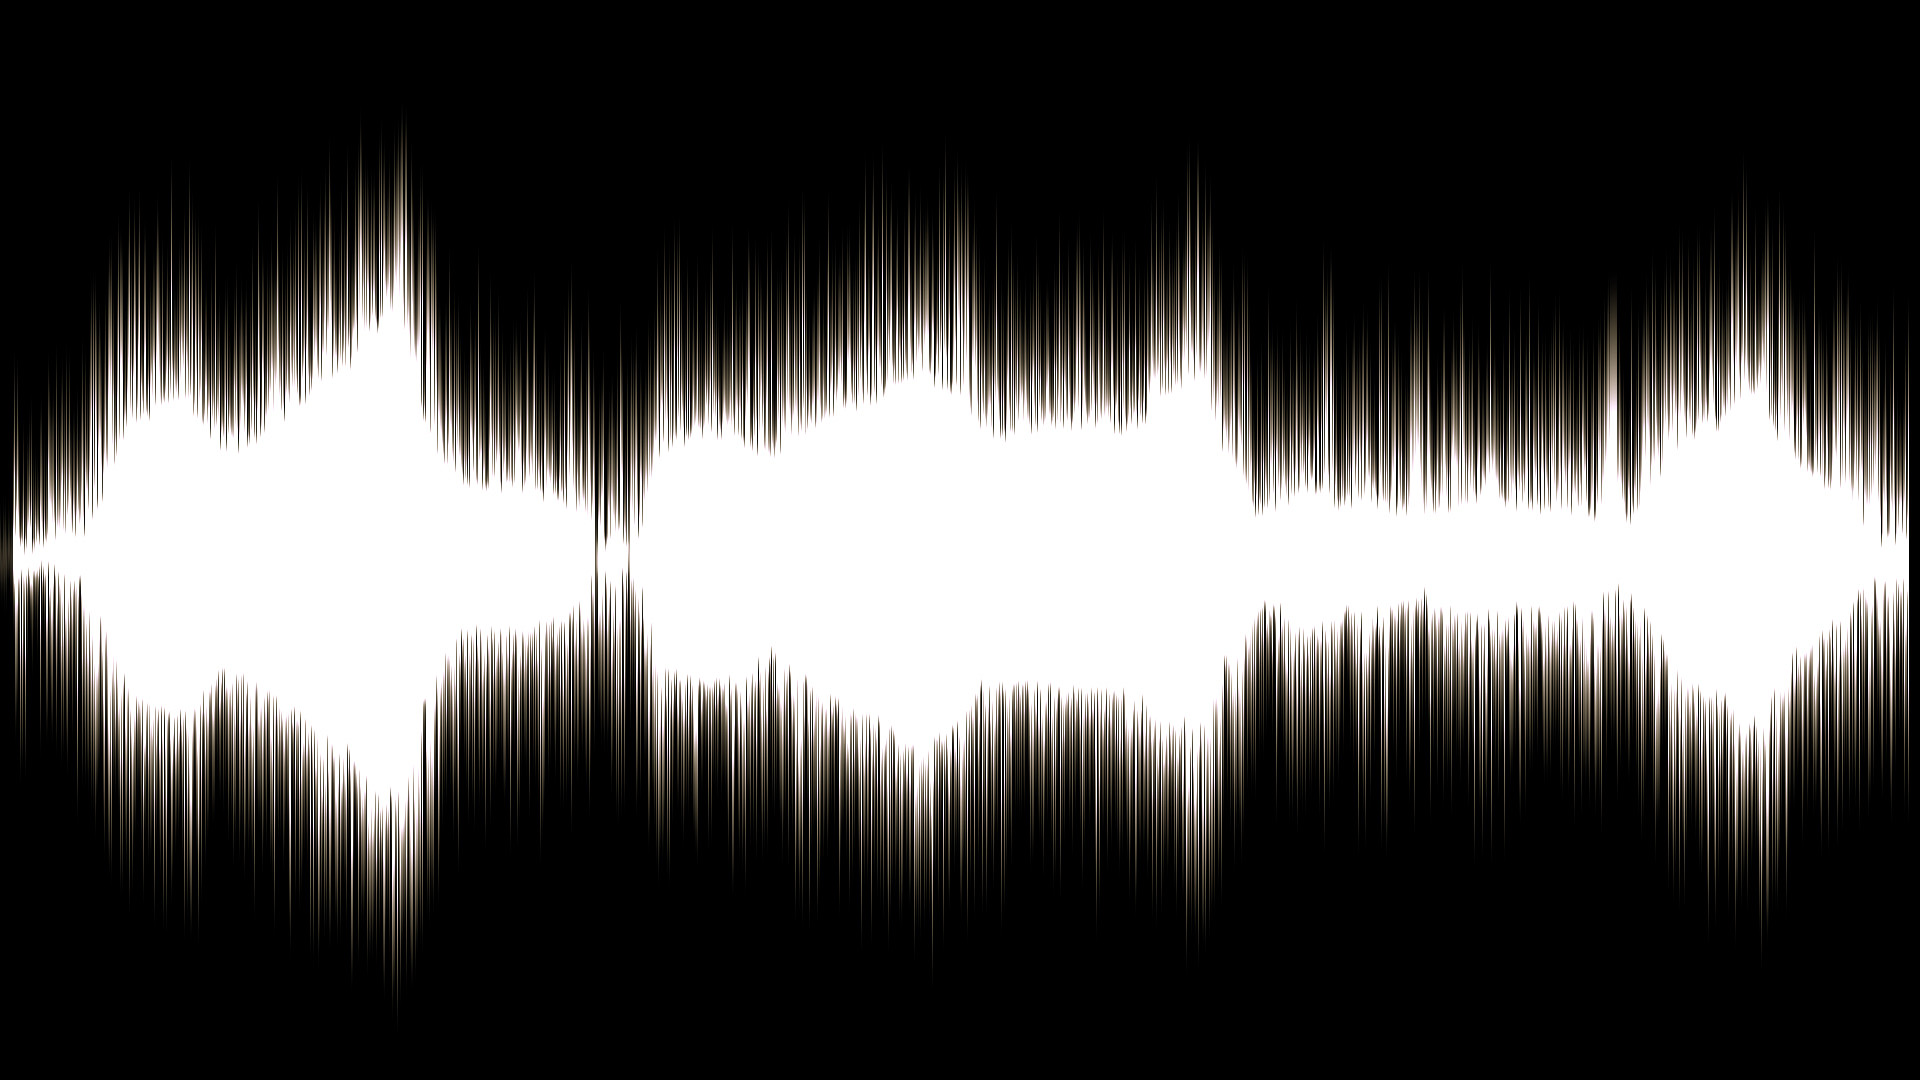
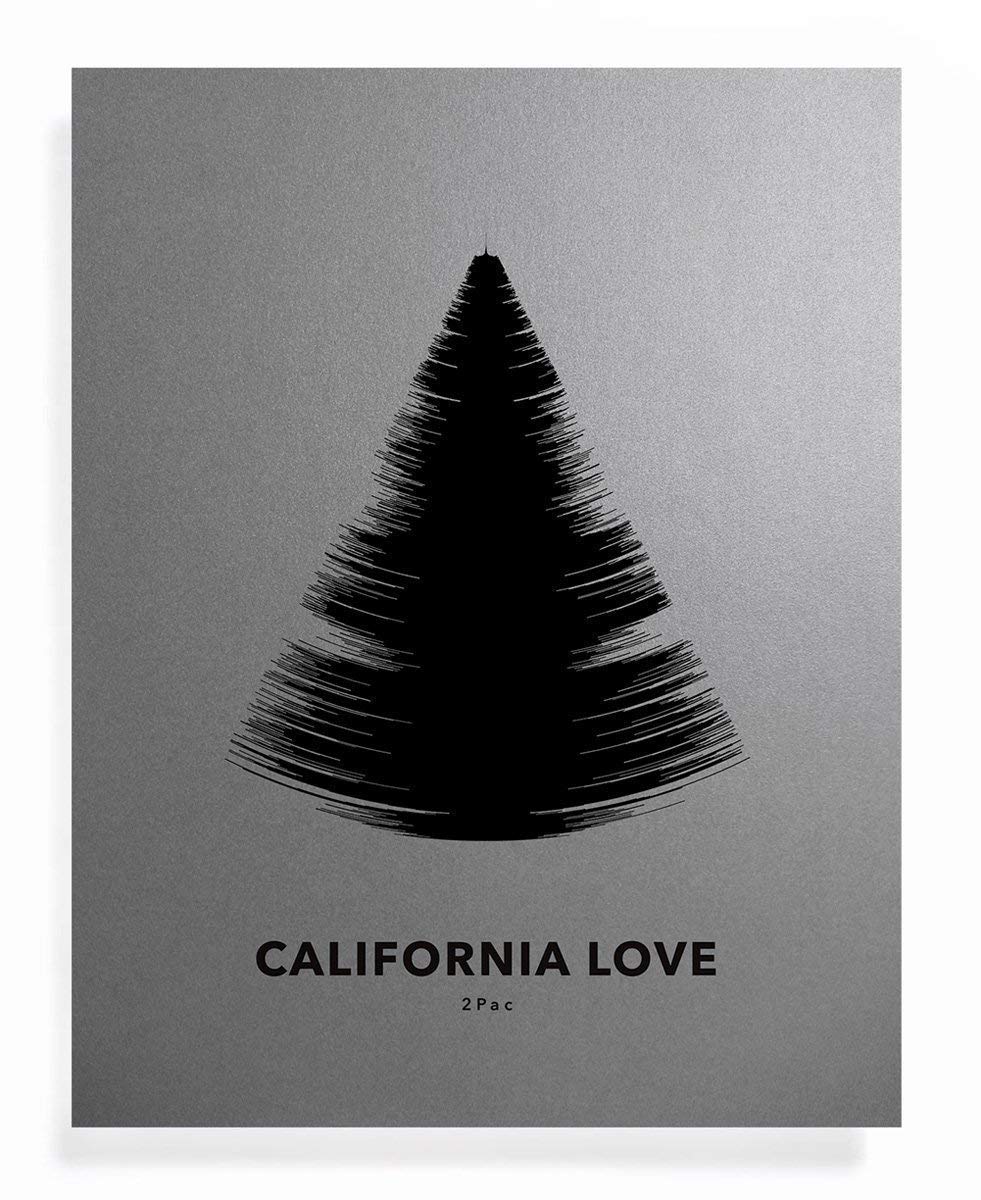
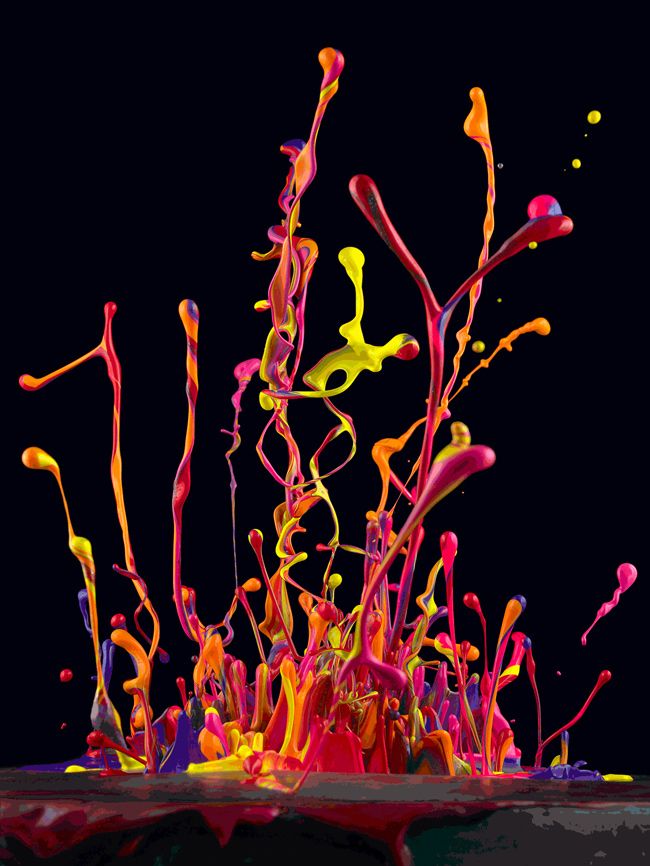
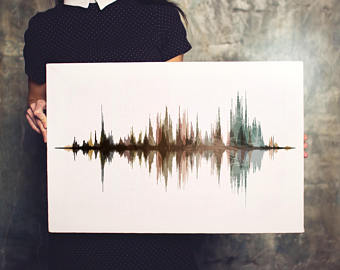
Out of all the images I collected, the pixelated ones draw my attention because they stood out with stylish visual designs. In addition, some of the ‘drawn’ waves also have cool aesthetics, which I think is a good direction to go to.


Apart from the images, I also found some really cool experiments on sound waves:
This is called the Chladni plate experiment, the sands form into different patterns and shapes base on different frequencies through vibrations on a metal plate. When metal plate vibrates, sands will go into the areas that have no vibrations in order to create theses interesting patterns.
This video is extremely inspiring because it gives me another idea of visualizing sounds not only through sound waves, but also from these patterns.
Furthermore, I found this image whilst I was doing my research:
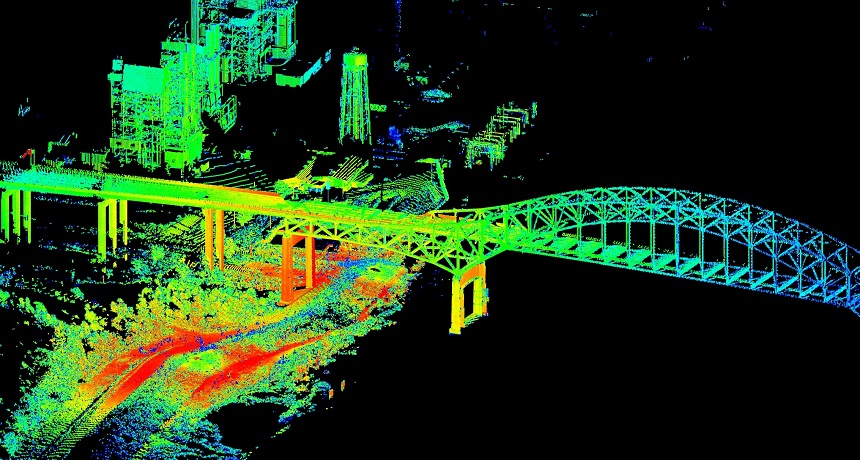
This is an image of a city scanned by lidar. It gives me a snap which I think would be cool to make a map like this by using soundwaves.
Here are some impressive examples:


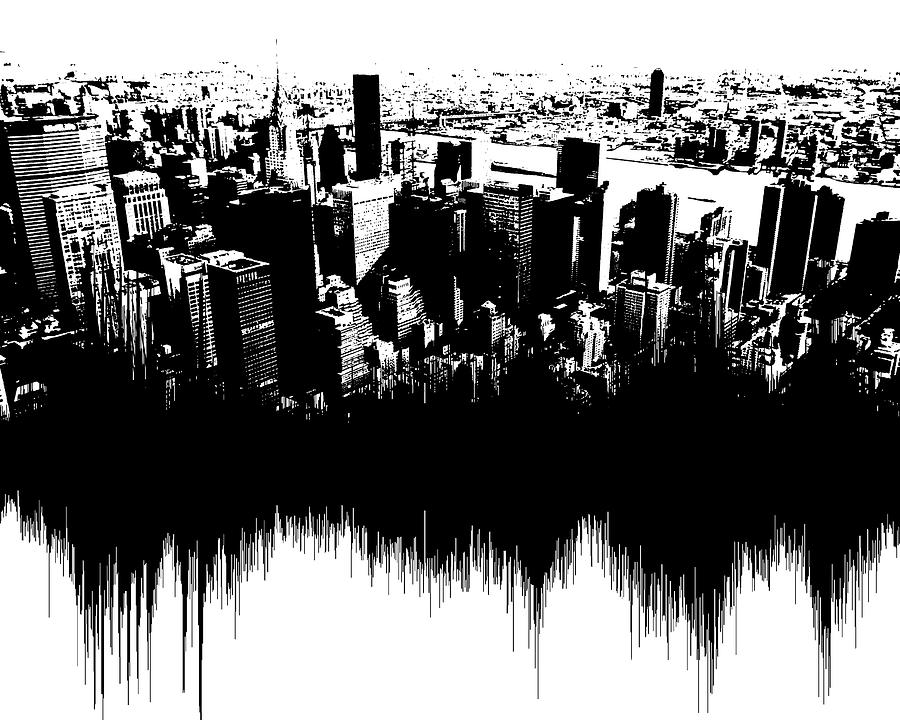


I particularly like the idea of combining both cities and sound waves because aesthetically they do have strong connections: High-rise towers and loudness, a rank of buildings and series of sound.
Initial reflection ② :
For my reflection, I wanted to do something that is similar to what Chaldni did, however it is impossible to carry out the experiment without professional instruments. Therefore I had to give up on this idea. Instead, I will be recording or finding secondary videos for the three sounds base off my brainstorm(School bell, footstep and game music I made), and then visualize their soundwaves, just like what the artists did above. I used preset brushes in Procreate to make these experiments, and here are the outcomes:
School bell.


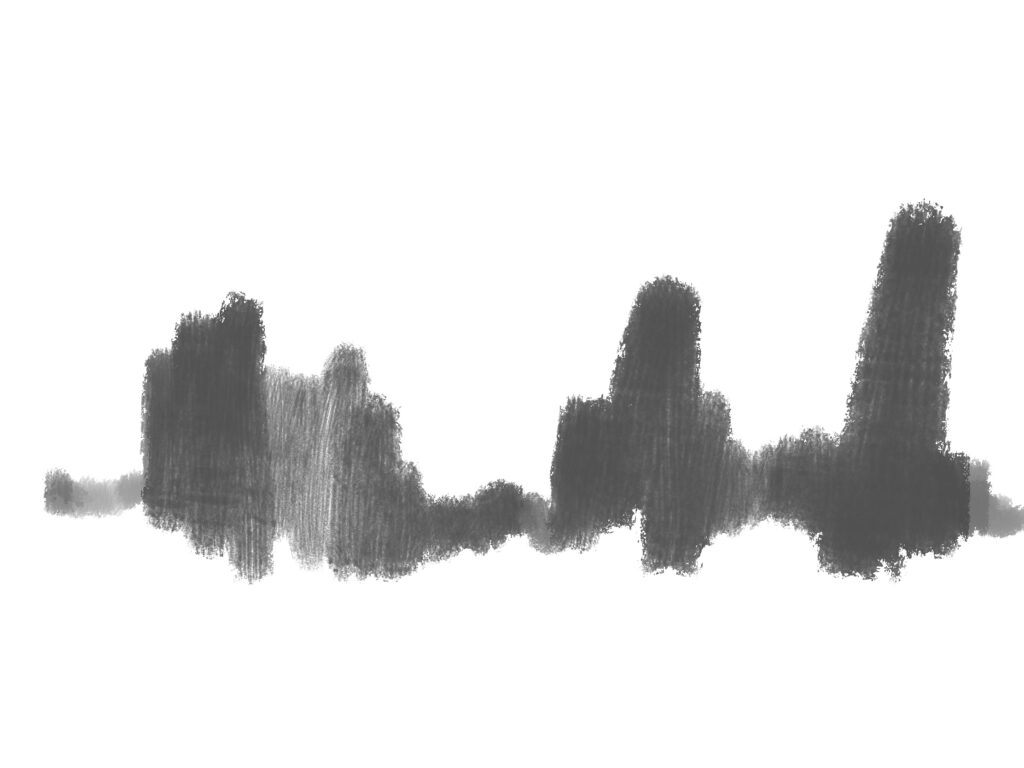


Footsteps.


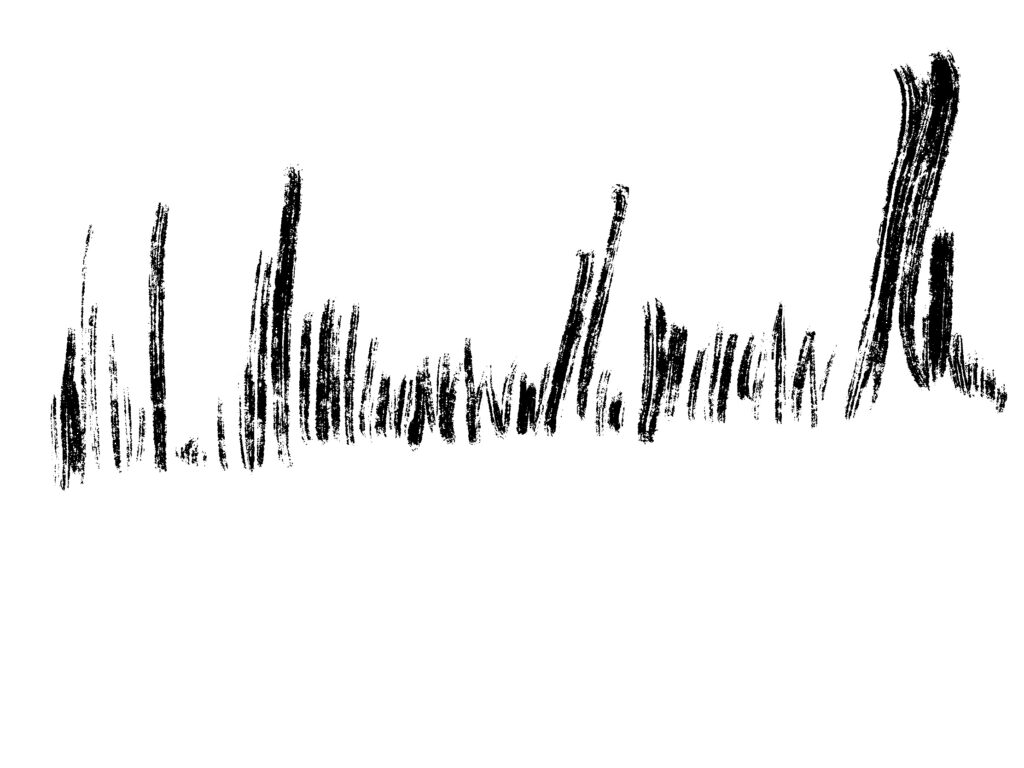


Game music I made.

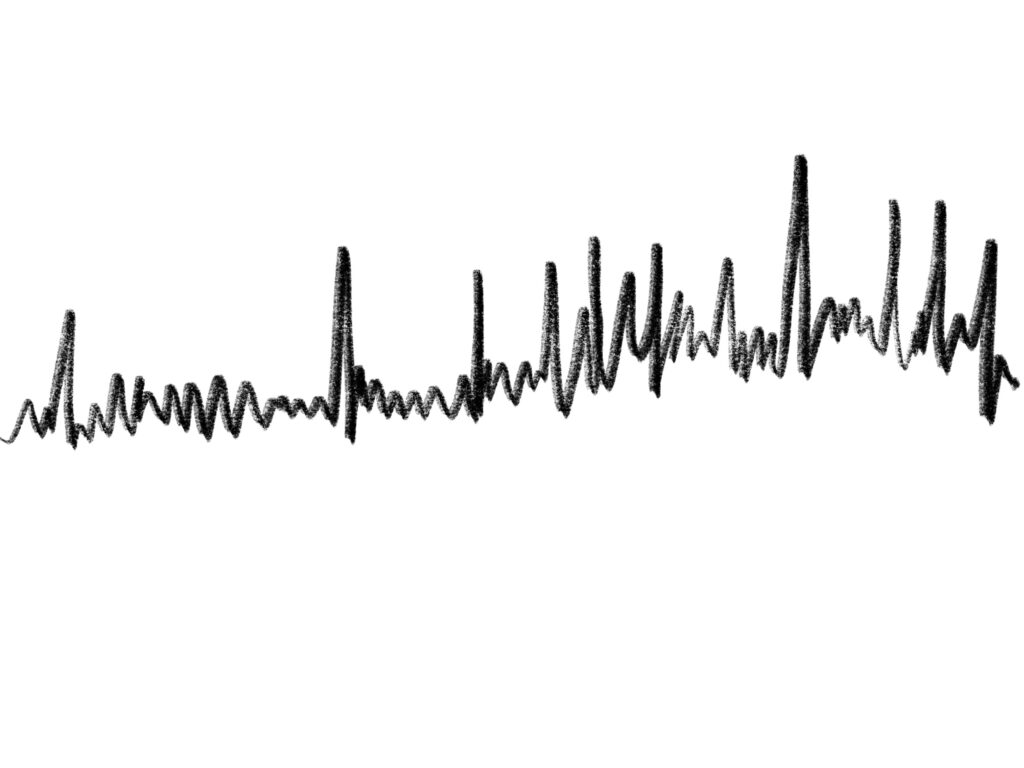


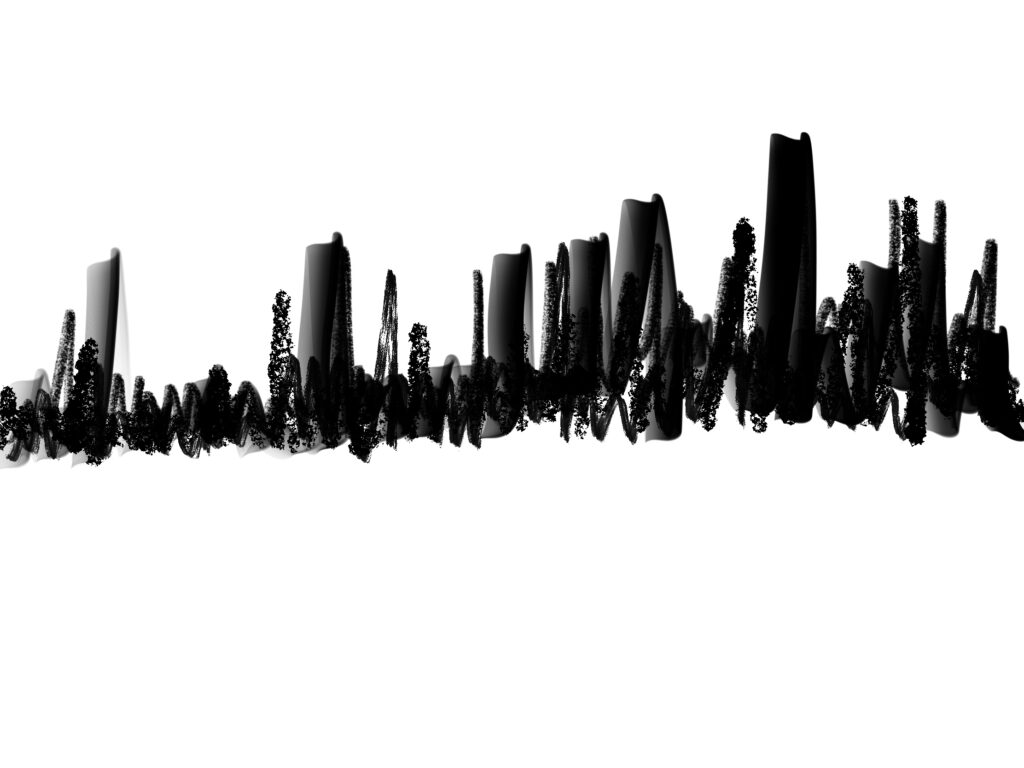
Overall, I like how different textures can be combined and turn into something very experimental, but with good aesthetic at the same time. I am thinking about using these test pieces as parts of my sound visualization in the fianl piece.
Synesthesia.
Synesthesia is a big thing which I didn’t mention but exists in the above research. Before diving into it, let’s take a look at what synesthesia really is:
According to Psychology Today:
Synesthesia is a neurological condition in which stimulation of one sensory or cognitive pathway (for example, hearing) leads to automatic, involuntary experiences in a second sensory or cognitive pathway (such as vision). Simply put, when one sense is activated, another unrelated sense is activated at the same time.
This is a suitable topic for my theme, because everything I have done so far has strong relations to sounds. Here are some videos about synesthesia:
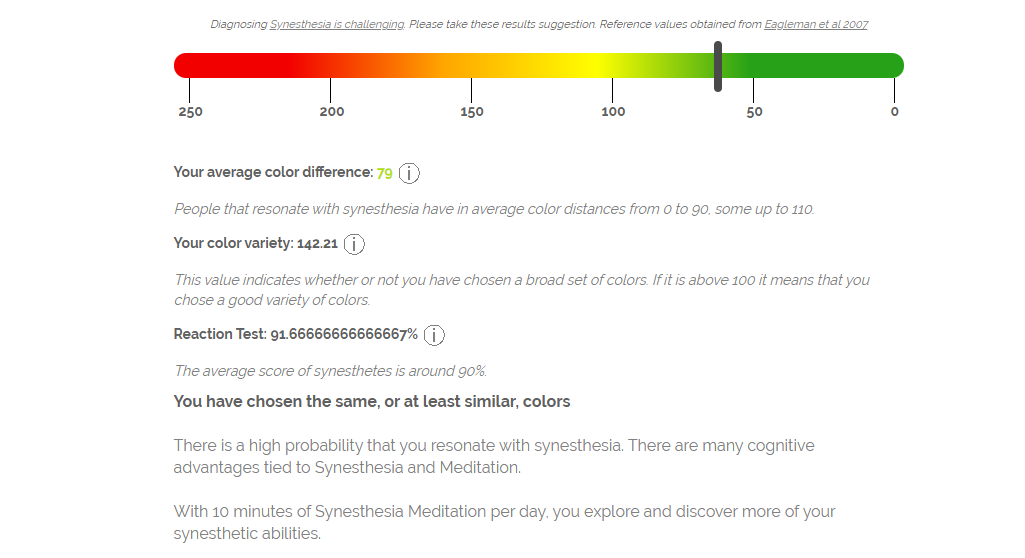
I also did a test on Sensorium and found out that I do have a little bit of Synesthesia, only checking this for fun:
By searching Synesthesia, I found an artist called Wassily Kandinsky who painted his work by listening to music, and apparently he used his ability of synesthesia as part of his technique in his creation process:
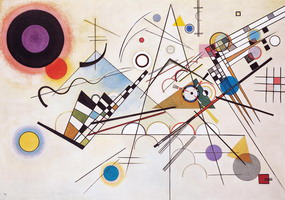
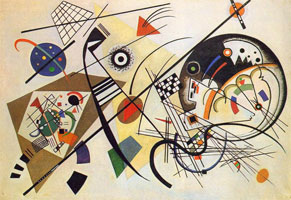
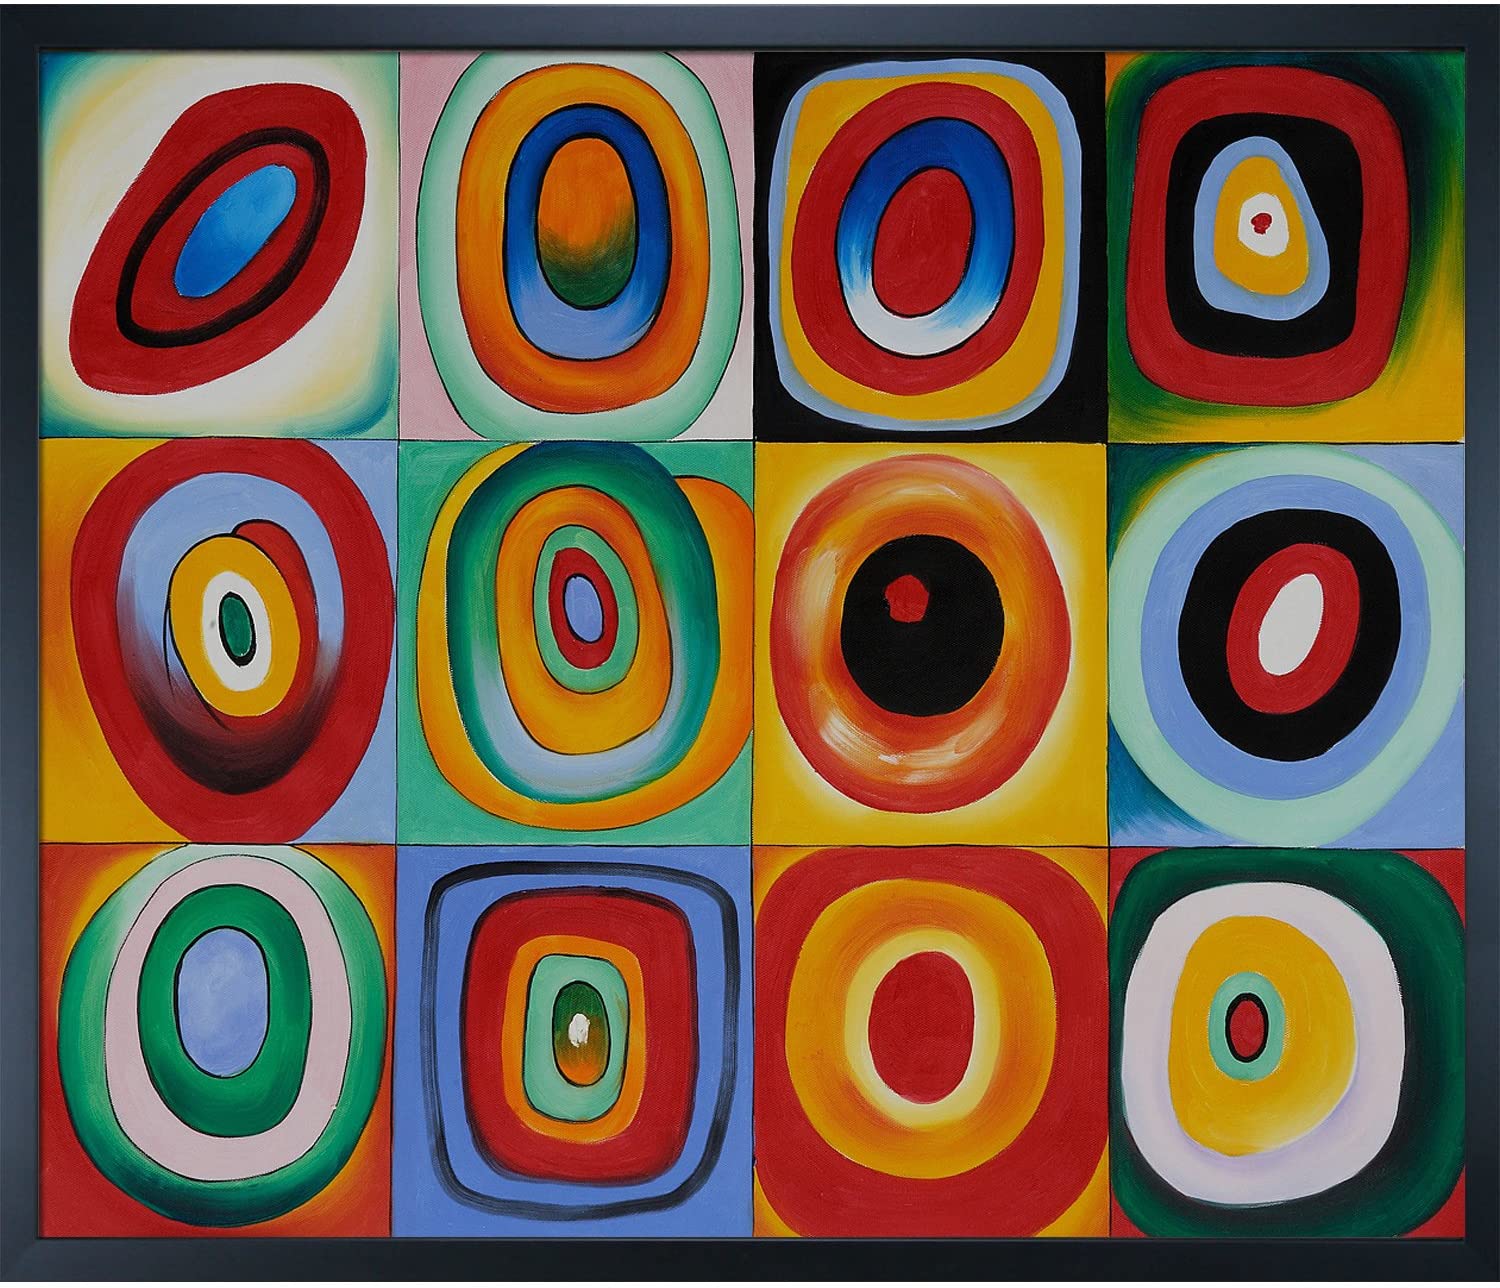

Here is a little bit about Kandinsky and his synesthesia, reported by Gerard McBurney:
To support his colour theories, Kandinsky appealed in his manifesto to the evidence of synaesthesia, the scientific name for the condition in which the senses are confused with one another (as when someone hears the ring of a doorbell as tasting of chicken or whatever). He wrote enthusiastically of how “a certain Dresden doctor tells how one of his patients, whom he describes as ‘spiritually, unusually highly developed’, invariably found that a certain sauce had a ‘blue’ taste”. This touching medical support for the idea that a spiritually superior person will naturally perceive the significance of the kinds of colour connections that he is talking about leads Kandinsky on to a grandiloquent cascade of musical metaphor: “Our hearing of colours is so precise … Colour is a means of exerting a direct influence upon the soul. Colour is the keyboard. The eye is the hammer. The soul is the piano with its many strings. The artist is the hand that purposely sets the soul vibrating by means of this or that key. Thus it is clear that the harmony of colours can only be based upon the principle of purposefully touching the human soul.”
By knowing more about Kandinsky, I do realize that synesthesia can be a core element to visualize colours in sounds for my project. I did think of the formation of my map whilst I was doing my previous research, but by looking into synesthesia, I expanded my new concept which is ‘creating a colour palette from the sounds in my memory’.
Initial reflection ③ : Sound palette.
Here is the colour palette I made based on the sounds:
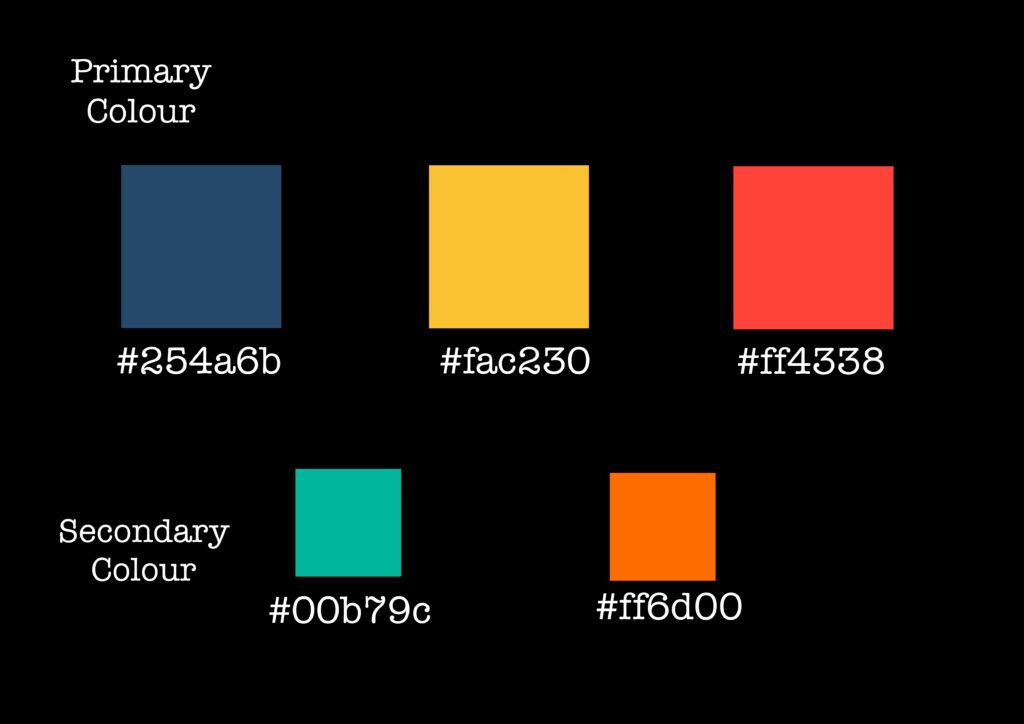
I can feel the colours by listening to the recordings, this is caused by many things, such as the weather, clothings or objects that have strong colour indications. I splitted the colours into two categories: Primary and Secondary. The reason of doing this is because I want two more colours to serve as trasitions between the three, other wise there will not be enough variety in my colour palette.
Primary colours:
Dark blue (#254a6b): This is the game music I made. The game is set in the universe, which has lots of cold colours such as blue, green and purple, this is why I see this colour when hearing the recordings.
Yellow (#fac230): This is the colour that I see when hearing ‘Footsteps’ recordings. The reason is because when there is a parade day, it is always hot and sunny, which both have strong connections to the colour yellow.
Red(#ff4338): My school always finishes at 5pm, which is the time when sunset occurs. Therefore red is the colour in this memory specifically.
Secondary colours:
Mint(#00b79c): This is part of my game music colour, helps transisting from Dark blue to yellow.
Orange(#ff6d00): This is part of my school bell memory. It helps transisting from yellow to orange.
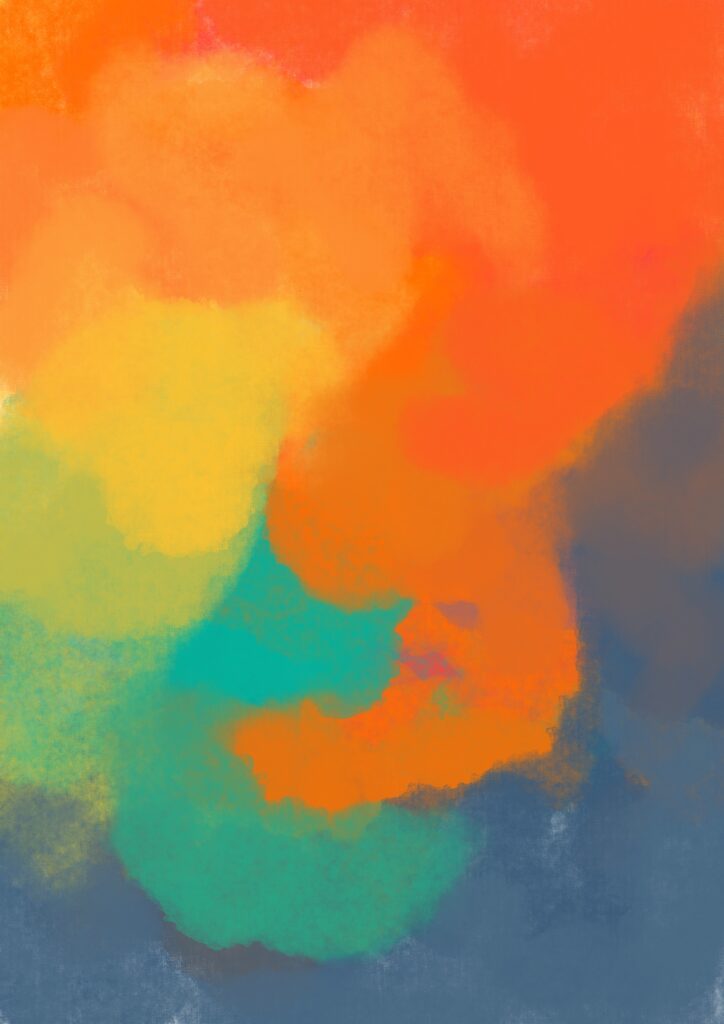
As soon as the colour palette is set, I then moved onto creating some colour work base on the palette, here are the outcomes:


Speech.
This is a relatively wholesome description I found from Wikipedia:
Speech is human vocal communication using language. Each language uses phonetic combinations of vowel and consonant sounds that form the sound of its words (that is, all English words sound different from all French words, even if they are the same word, e.g., “role” or “hotel”), and using those words in their semantic character as words in the lexicon of a language according to the syntactic constraints that govern lexical words’ function in a sentence. In speaking, speakers perform many different intentional speech acts, e.g., informing, declaring, asking, persuading, directing, and can use enunciation, intonation, degrees of loudness, tempo, and other non-representational or paralinguistic aspects of vocalization to convey meaning. In their speech speakers also unintentionally communicate many aspects of their social position such as sex, age, place of origin (through accent), physical states (alertness and sleepiness, vigor or weakness, health or illness), psychic states (emotions or moods), physico-psychic states (sobriety or drunkenness, normal consciousness and trance states), education or experience, and the like.
In summary, speech is a way to transpass information through vocal sounds. It is a much more straightforward way to describe something without music, soundwave or synesthesia.
Here are some good examples of speech and poem:
Motivational speech
Story-telling
poetry
Through listening and analysing these clips about either speech or poetry, I was amazed by how well the speechers can create immersive experiences for the audiences only by describing things through words. This is another thing that I would like discover more in this project, because I don’t need to present the memories only through sounds, but also words to describe what they sound like, it will probably create another unique experience. This reminds me of the concept I came up with from Guqin experiment: It doesn’t matter what they sound like, it is more important to know how the sounds were created. I think it would be a great collaboration of these two themes(music notation & speech) in my map.
In addition to the speech, I remembered a scene in a film I watched a couple of months ago. The film is called In the House. The story of the film didn’t catch my eyes too much, but the amount of artistic theories that appeared in the film was surprisingly attractive. There is this scene where a person is describing an artist’s work: This is a painting of nothing, you will be hearing word descriptions from this audio set and see the painting through your imagination.
This an idea that was truly inspiring especially for this project. I have been trying to find a way to visualize my own sounds in my own memory, but different people will have different reflections base on the word descriptions.(which happens a lot after reading novels).
In conclusion, I can do something similar to this concept, but instead I will describe the sounds I heard in my memory(without actual recordings) to see what will come out as results.
Initial reflection ④ : Describe the sounds.
In this reflection, I will be describing the sounds with simplest sentences, base off the recordings I have in the previous reflections.
School bells.
I was walking home after school. My friends were tidying up their space. Chairs were moving, people were chatting. I heard the crowd, the cars and the trees. When all these happened, the school bell rings.
Footsteps.
It was a parade Sunday, when everyone was wearing polish shoes, and made the loudest footsteps. School band gave us the rhythm, and we followed. Parents were chatting and enjoying the perfect harmony between flute and brass.
Game music I made.
I used cool sound effects to support the gameplay, they were mostly rhythmic with clear patterns. Electronic and classical made a perfect combination in this case.
Final idea – Making the map.
The concept of my final idea is to create my own interactable music notations in order to visualize my sound memories, as well as letting the audience to experience what I heard, abstractly.
I will be creating my own musical notations base on the inspirations from Guqin notation (Single block of notation can tell a story, through sounds). I will be using graphs, symbols or words to put together a block of notation, and that will be a representation for one of my sound memories.
The aim of this concept is to allow anyone to interact and experience my sound memories, therefore it will be interactable whether the audience has experiences on music before or not.
Audiences will only be required to make sounds through simple ways, such as clapping, rubbing or whistling. However, this will depend on how they would like to express the sounds, sometimes instrument could be a better choice.
Furthermore, as part of the music notations, I will be using words to describe the sounds, and people can use those as references to support their outcome. The reason of doing this is because people perceives sounds differently, therefore we all have different expressions of sounds in our memory, and that is why I would like to make my music notation to be easy accessible, so that people are not only experiencing my memory, but also recreating to make it their experiences.
Chladni plate, city-like soundwave and synaesthesia colour palette will be used to support my idea and aesthetics on the map.
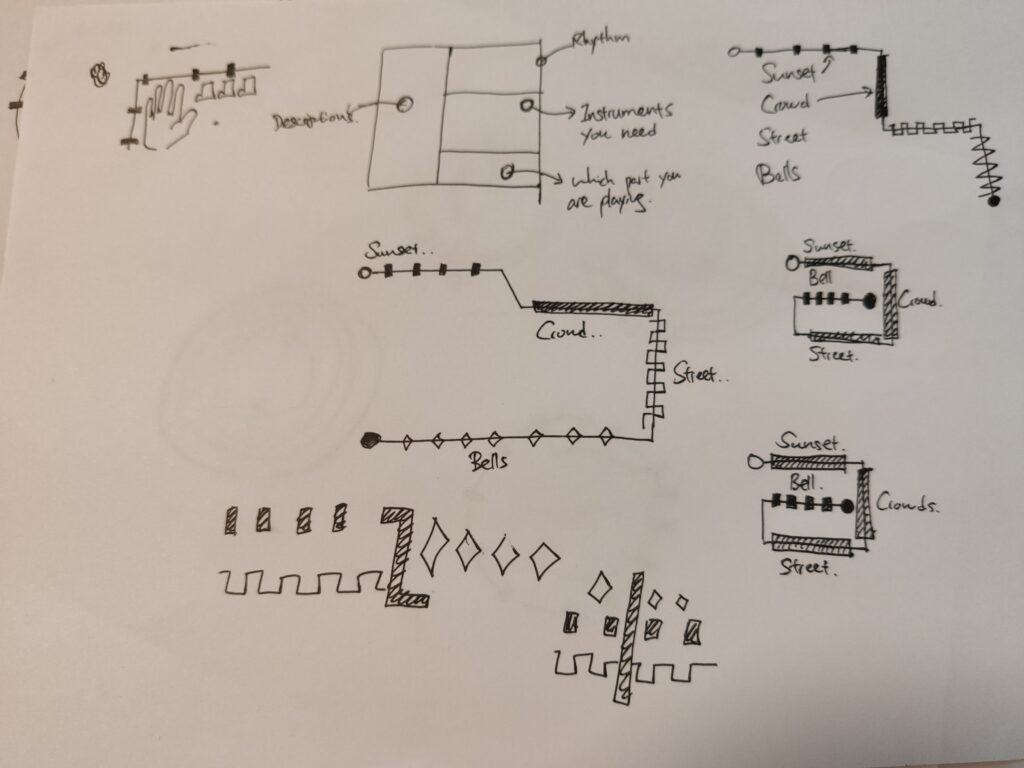
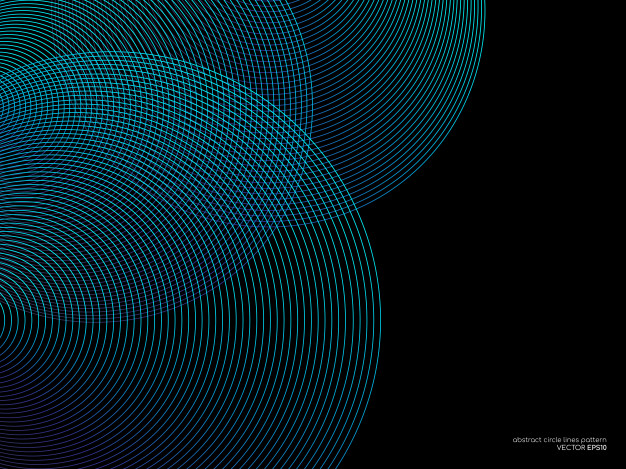
The very first thing I did was to come up with a visualization in order to compile all the information, that I want to deliver to the audience. I looked back on what I did with ‘Reflection 1′, and realized that if I am telling them how to make the sound, the outcome will be hugely limited, which is something I don’t want the audience to receive. Therefore, I started to look into other ways which could possibly instruct the audiences. At the same time, I saw a circuit diagram which inspires me where to go next.
I quickly sketched some lines and symbols base on the circuit diagram to help me expand my ideas, which was very useful because I did come up with some interesting results after testing them out. I looked into what the experimental musicians did in the past, and realized that reading symbols and lines are a lot easier than reading the words. Therefore, I tried out some different combinations of lines and symbols, including the circular ones:

Personally I think the circular designs look more interesting than the regular ones, and by turning them all into circles make it easier to read, as well as storing information. Therefore I decided to go for this idea.
Here is the sketch for the final composition:
In the sketch above, I was mainly testing the composition between circles, how each sound is represented in the circle and how the colours would work in the outcome.
Once the sketch is clear and ready to be developed into the final piece, I then moved onto the next stage, which is making the map.
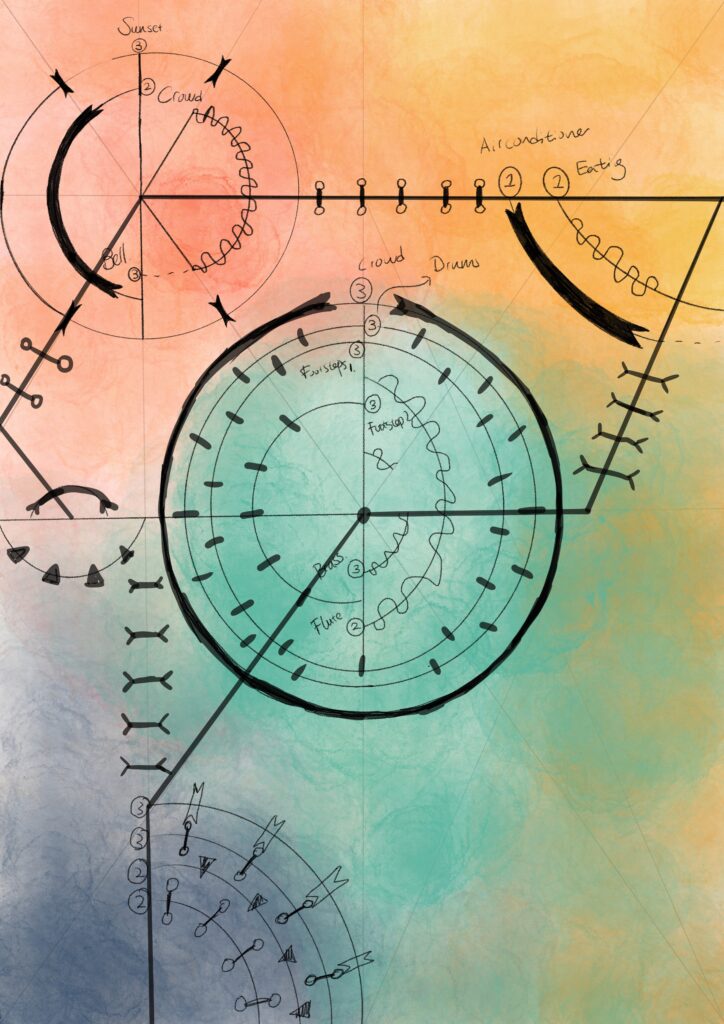
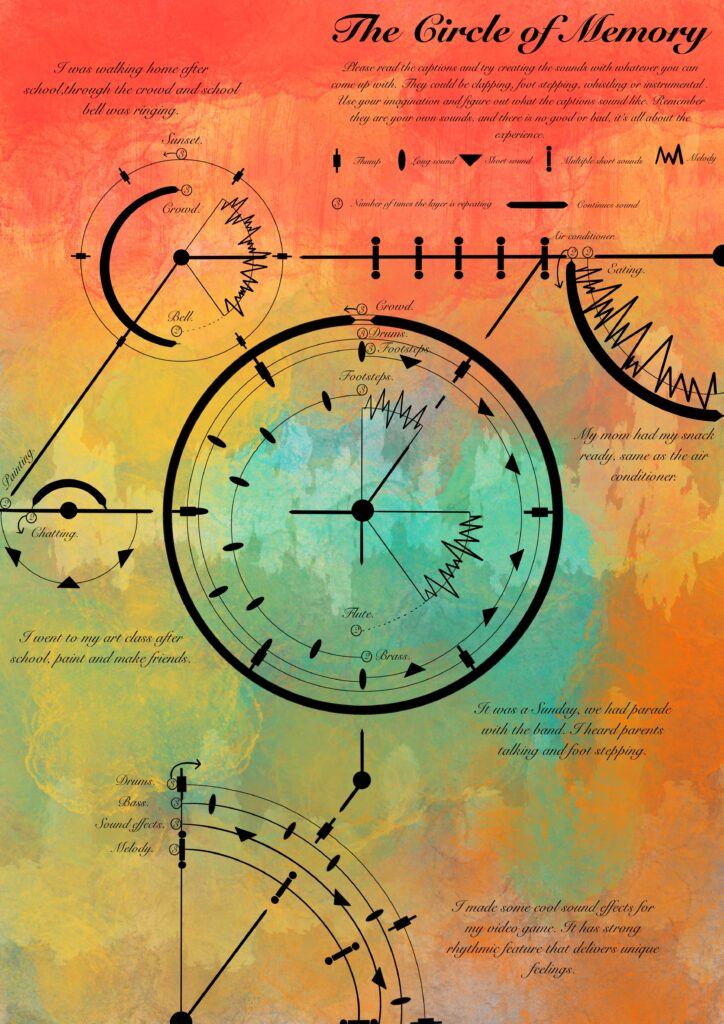
Image below is the outcome of my final idea:
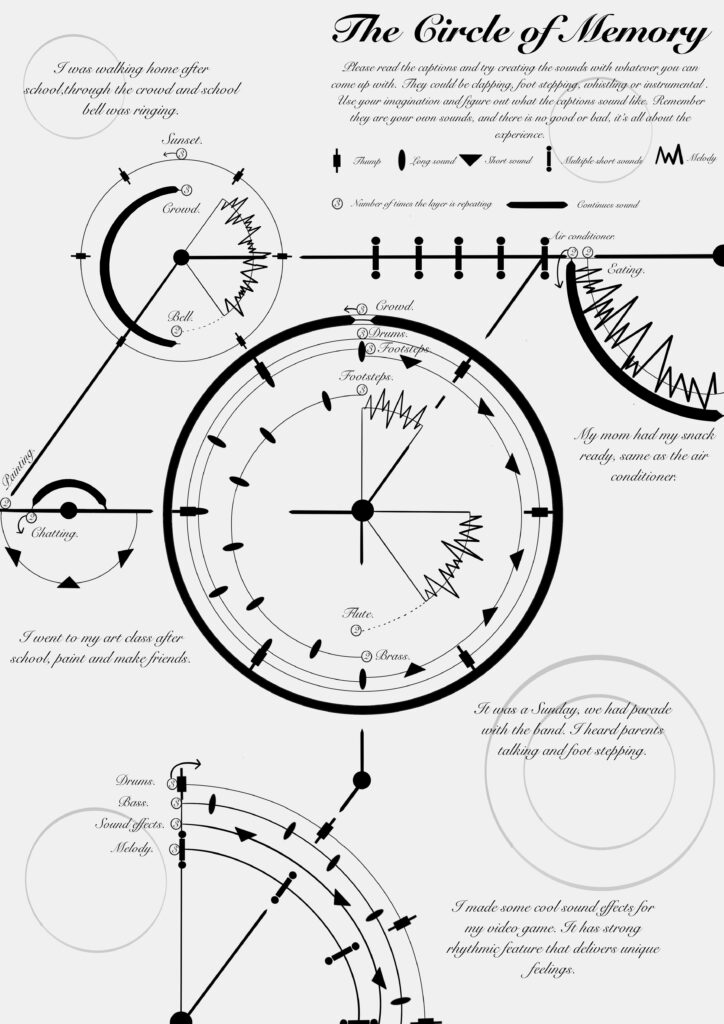
This diagram is basically constructed with three features: captions, symbols, and lines(circular and straight).
Captions: This is the description I experimented in ‘Reflection 4′, which is describe particular sounds only through words. The reason for this is because words can help the audience to create images in their heads, which converts the sounds in my memory into theirs.
Symbols: I made these symbols look differently between each other. This is done for making sure that the audiences understand what kind of sounds they are making. Furthermore, the distances between each symbol represents the rhythm of the sound.
Circular lines: There are two full circles and the rest of them are either in a half or quarter. The reason of designing the main body into circles is because I want to make a connection to the clock. As we know that we read time through clocks, and time is an important feature when memorizing things. This is why I use circular lines in the diagram, they are the clocks that carry out my memories. Furthermore, in most of the cases, audiences are reading them anti-clock wise, which has meaning of ‘thinking backwards to memorize’.
Straight lines: All sounds are connected by straight lines, which tells the audience where to go after a sound is finished.
For how to play the music, please see the diagram:
After making the basic black and white diagram, I then decided to implement my synesthesia sound palette(Reflection 3) and sound wave(Reflection 2) into the final version, here are some tests I did:

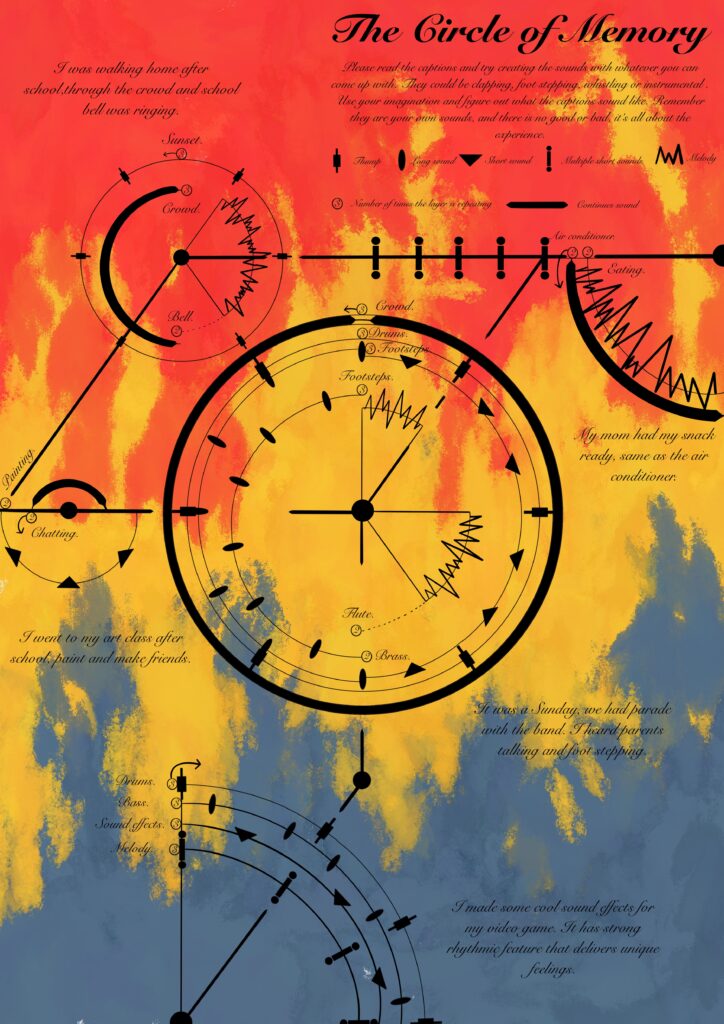
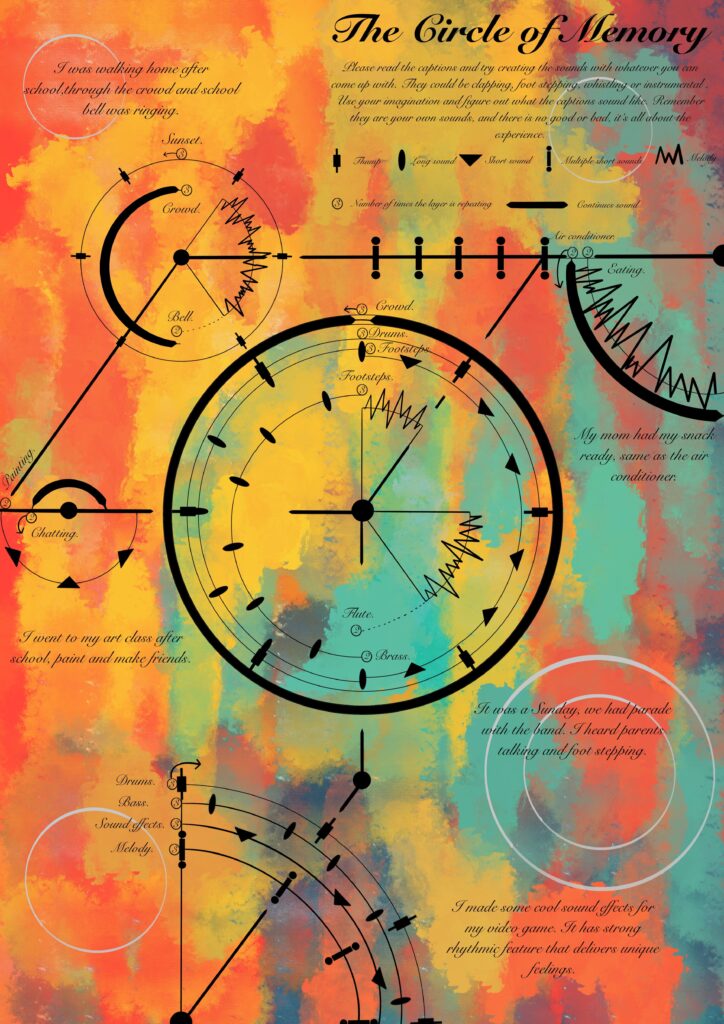
Image on the left: In this work, I used the same technique as I did in ‘Reflection 2‘, which is visualize 3 sound waves with different textures and techniques. Turns out it looks pretty cool, but a little bit plain.
Image in the middle: In this work, I applied one of the test pieces in the background and see how it looks. Personally I don’t really like this one because it is too dramatic which expresses agressiveness to the audience.
Image on the right: I applied another work I did previously in the background, and it doesn’t look too bad. However, the colours are standing out from the background too much, which distracts the audiences from reading.
Finally, I applied a raletively softer piece in the background and combined with the three sound waves I tested above. The outcome has greate aesthetic and clear visualization, which becomes the final map that records my journey for project 1.
Furthermore, I recorded the map on my violin, here is the outcome:
School bells:
Footsteps:
Game music I made: